

Beyond Conventional Support and Resistance
In traditional technical analysis, support and resistance levels are often defined by price history - recent highs and lows, moving averages, Fibonacci retracements. But this model has a fundamental weakness: it is reactive. It tries to extract meaning from historical price behavior rather than understanding the forces that shape future price movement.
In contrast, DML levels - generated by the Deep Market Level system - are not the result of historical chart patterns.
Independent of Timeframe, Dependent on Intention
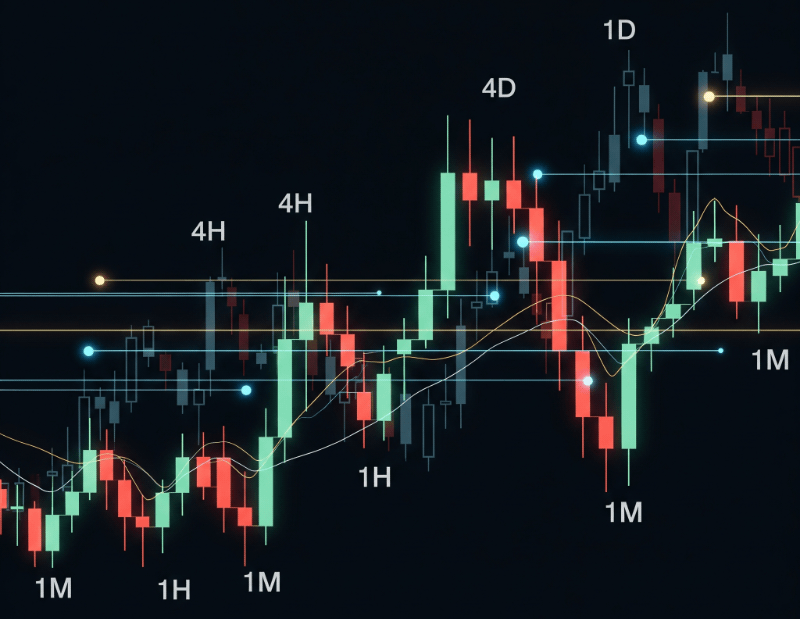
Most traders instinctively view support and resistance through the lens of a specific timeframe. DML levels challenge this perception.
Whether you're trading on a 1-minute or daily chart, the position of a DML level does not change. That's because it's not tied to your chart - it’s tied to real flows and the statistical density of liquidity detected in a multi-layered market model.
DML levels reflect where liquidity tends to cluster - where Smart Money prefers to execute or react. They are not by-products of candles; they define the zones to which price reacts.
Price Responds to the Level - Not the Other Way Around
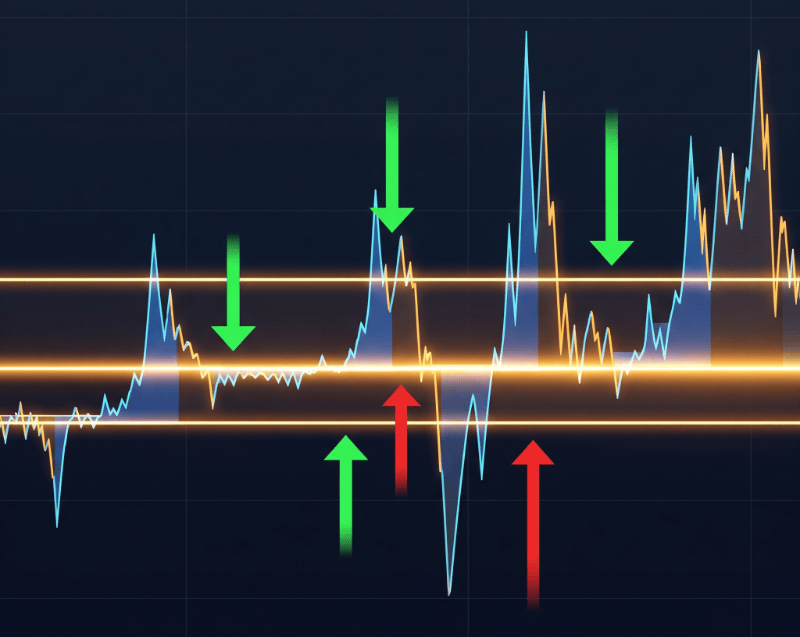
This is a key shift in perspective: in the world of DML, it's not the support or resistance level that "forms" because the price stopped there.
It’s the price that reacts to the level.
When a DML level holds for several minutes, it creates a DML Zones. This is a high-probability area where institutional intentions have stabilized. If the level fluctuates every minute, it creates a dynamic area where liquidity is being reshuffled.
Over time, patterns of price behavior around these zones begin to emerge with clarity: reactions, retests, avoidance, absorption.
Session-Specific, Region-Specific Dynamics
Not all currency pairs behave the same way. Why? Because not all trading sessions bring the same volume or type of flow.
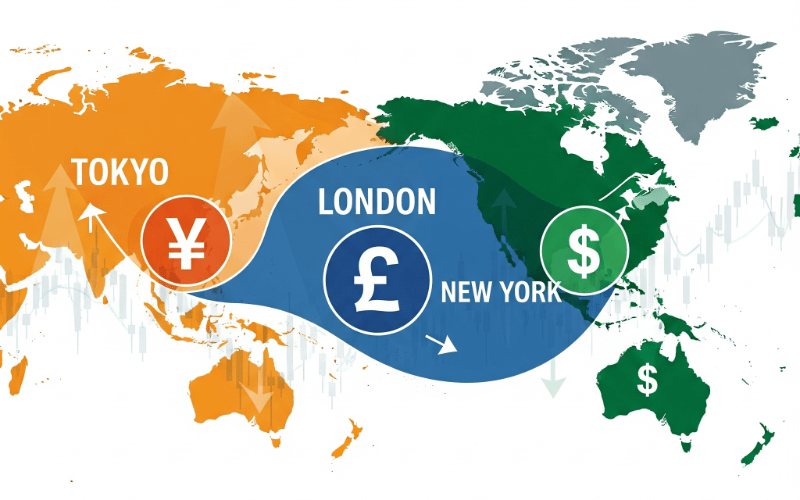
The reaction to DML levels can vary greatly depending on whether a pair is dominated by Asian, European, or North American currencies - and depending on the time of day.
- Asia Session (Tokyo): Often slower, more deliberate movements. DML levels tend to act as magnets for stop-hunts and pre-positioning.
- London Session: High-volume breakout and retest dynamics. Reaction to SMZ levels becomes particularly evident here.
- New York Session: Volatile reversals, trend continuations or final manipulations around key levels.
The temporal and geographical context matters - and our DML methodology captures it better than traditional tools.
The Function of Time and Decision Horizons
The DML system works minute by minute. But time is not just a measurement - it defines the strength and type of the level.
- A level that remains constant for 1-5 minutes may not carry significance.
- A constantly changing level a sign of rebalancing and liquidity movement.
By observing how price interacts with these time-bound zones, traders can start recognizing consistent behavioral patterns. Patterns that can be modeled, verified, and - eventually - leveraged with confidence.


Verify the Theory - Don’t Just Believe It
We don’t expect you to take our word for it.
That's why we offer a suite of Expert Advisors (EAs) - not for automated trading, but as laboratory tools for serious market analysis.
These EAs allow you to:
- Run historical backtests across any currency pair and timeframe to see how price reacted to DML levels across minutes, hours, and months.
- Eliminate cognitive bias - the EA doesn't interpret, hope, or fear. It executes. The results you get are data-driven and objective.
- Analyze thousands of setups in minutes: win rate, risk-to-reward ratio, entry behavior, volatility sensitivity - all at your fingertips.
- Accelerate your learning - test ideas, simulate scenarios, and understand the real behavior of the market through quantifiable interaction with DML levels.
These tools are the result of years of development, built with input from developers, quantitative traders, and feedback from hundreds of users around the world.
Your Path: From Observer to Researcher
We believe in empowering you - not promising you results.
The real power of DML is not in placing automatic trades. It lies in the knowledge, awareness, and insight you build by interacting with these levels yourself.
By investigating how price behaves around DML levels - across time, sessions, and instruments - you begin to uncover the invisible structure of the market.
Only when you understand that structure can you use it to your advantage.

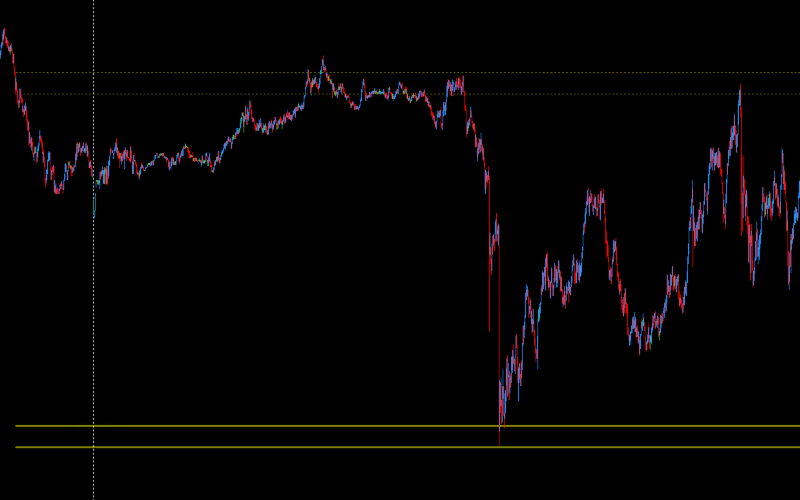
SkyBlue Levels: Daily Supports and Resistances With Institutional Precision
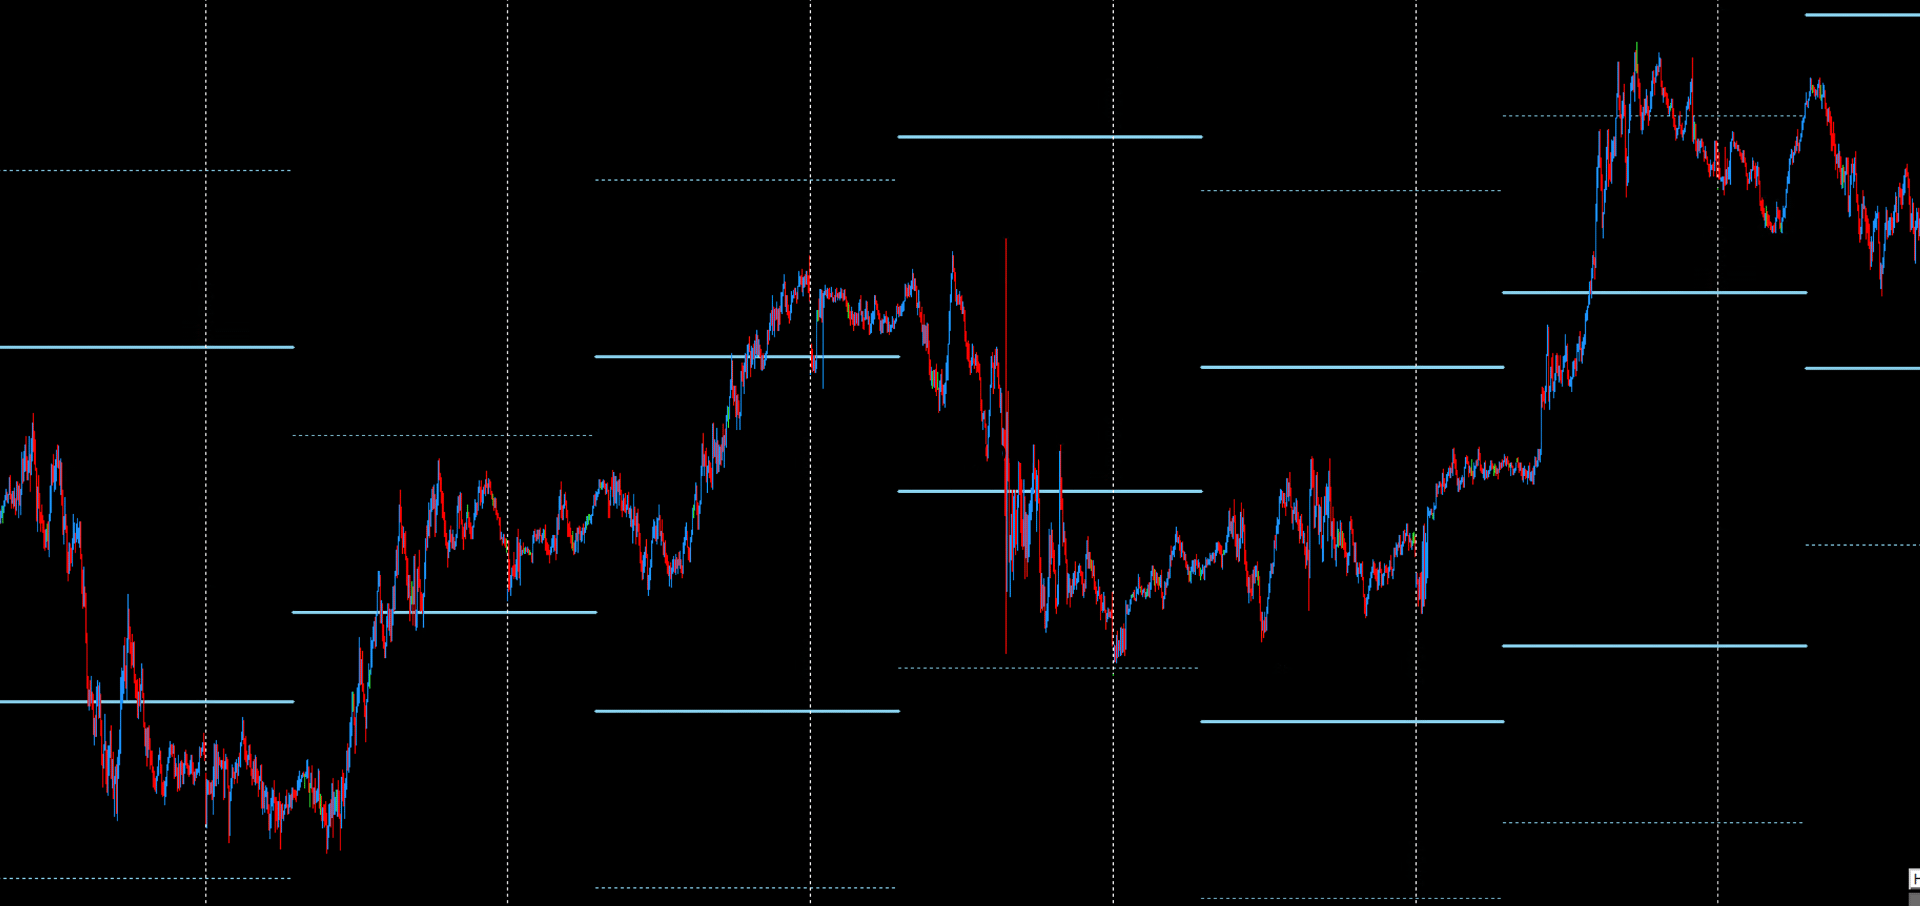
SkyBlue levels represent daily support and resistance zones derived from institutional activity and liquidity structure - not from price candles or highs and lows. Unlike Khaki or DeepSkyBlue levels, which can create Smart Money Zones over time, SkyBlue levels are single-point reference zones, updated once per trading day.
Despite being single values, they are exceptionally effective:
- Price tends to react sharply when approaching a SkyBlue level during the London or New York session.
- These levels frequently mark the exact turning points of intraday swings - especially when aligned with session openings or volatility bursts.
- In some market conditions, SkyBlue levels act as "magnets", drawing price before reversals or consolidations.
Their singularity is a strength. They do not change minute by minute. They reflect a snapshot of institutional positioning - and often act as a fulcrum around which the day’s liquidity rotates.
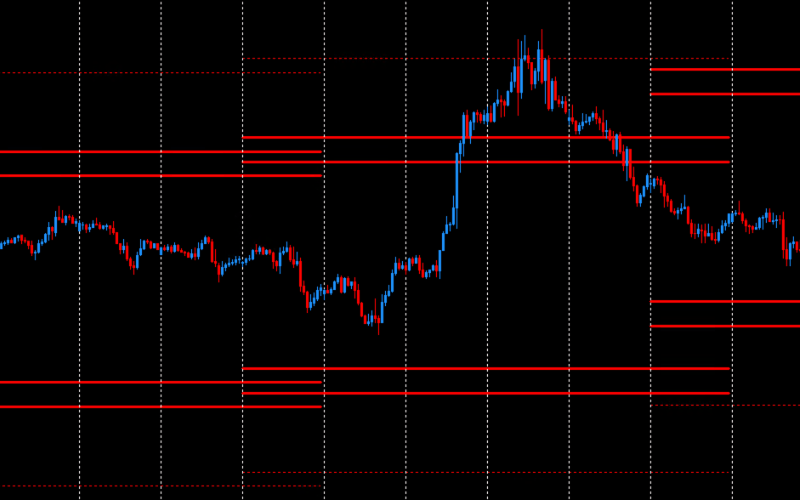
Red Levels: Weekly Support and Resistance Anchors
Red levels define key weekly support and resistance zones, updated every Wednesday. They reflect broader market sentiment and are relevant across multiple instruments and subsequent trading sessions.
Where SkyBlue levels define intraday precision, Red levels offer higher-level structure:
- They are often tested at the beginning or end of major trends during the week.
- Their reaction is typically more gradual but statistically robust - especially when price consolidates near a Red level after a sharp move.
- They serve as excellent contextual filters for intraday setups: entries near a Red level with SMZ confirmation carry high probability.
In some cases, Red levels become “invisible walls”, containing price within a range for days before a decisive breakout or breakdown.
The DML EA Olive Tool
Olive levels are key, daily support and resistance zones determined based on the Deep Market Level methodology. Their main advantage is providing precisely defined areas where a price reaction is expected. This allows for the creation of objective and fully testable trading strategies, eliminating subjective chart interpretation. They have been designed to enable effective trading automation around them.
DML EA Olive is an automated bot created for systematic testing and trading based on the Olive levels.
- Purpose: The tool's main task is to automate research and trade execution, allowing for the quick and objective verification of the effectiveness of strategies based on these levels.
- Strategy: By default, the bot uses a grid strategy, opening orders in reaction to price behavior within the defined Olive zones.
- Key Features: The EA is equipped with advanced modules for risk and position size management (including SL, TP, BE, and risk-based lot calculation), as well as time and trend filters (MMD). These features allow for the precise adjustment of entry conditions and help avoid trading in unfavorable market conditions.
Back To Zone
DML EA BackToZone is an automated "mean reversion" trading strategy. Its main task is to identify price consolidation zones, called "equilibrium zones," which form around a stable DML level.
The operational logic is that when the price sharply moves away from such a zone, the robot automatically opens positions in the opposite direction, anticipating that the market will correct and the price will return to the equilibrium zone.