DML FlowZone
DML FlowZone is a specialized tool for the MetaTrader platform, used to identify and visualize zones of change in the level (flow) of liquidity in the market. The indicator analyzes unique data and automatically detects periods in which the value of the DML level remained variable for a specified time.
For the indicator to work correctly, you must download the appropriate DLL library and add your trading account number in the "Licenses" tab on the DeepMarketLevel.com website to authorize the downloading of DML levels for that account.

Global Parameters
Basic global settings for the indicator.
- Symbol Selection Mode: Symbol selection. `Automatic` detects the symbol from the chart. `Manual` allows for custom input below.
- Manual Name For Symbol: A field for manually entering the instrument's name (e.g., `EURUSD`).
- Broker Server Time (GMT): The time offset of the broker's server relative to GMT (UTC+0), crucial for correct data synchronization.
- Magic Number: A unique identification number. Must be changed if you use multiple instances of the indicator on the same symbol.
Candles Parameters
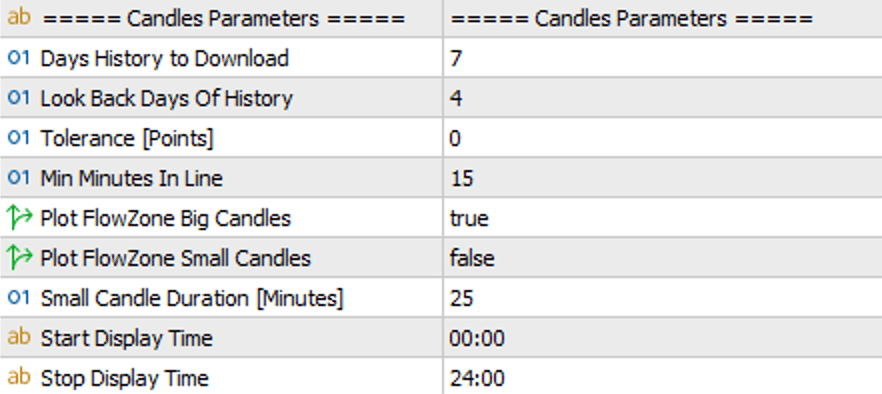
Parameters that define how the indicator identifies and draws FlowZone areas.
- Days History to Download: How many days of history should be downloaded from the DML server for analysis.
- Look Back Days Of History: How far back (in days) the zones should be displayed on the chart.
- Tolerance [Points]: The tolerance in points, which determines how close subsequent level values must be to be considered stable. When this level is exceeded, the indicator automatically identifies a FlowZone.
- Min Minutes In Line: The minimum time (in minutes) that a level must be stable before a change in its value—by the amount specified in the Tolerance parameter—creates a FlowZone.
- Plot FlowZone Big/Small Candles: Options to draw zones as one large candle or multiple smaller, consecutive candles.
- Start/Stop Display Time: The hours during which the zones will be visible on the chart.
Visual Parameters
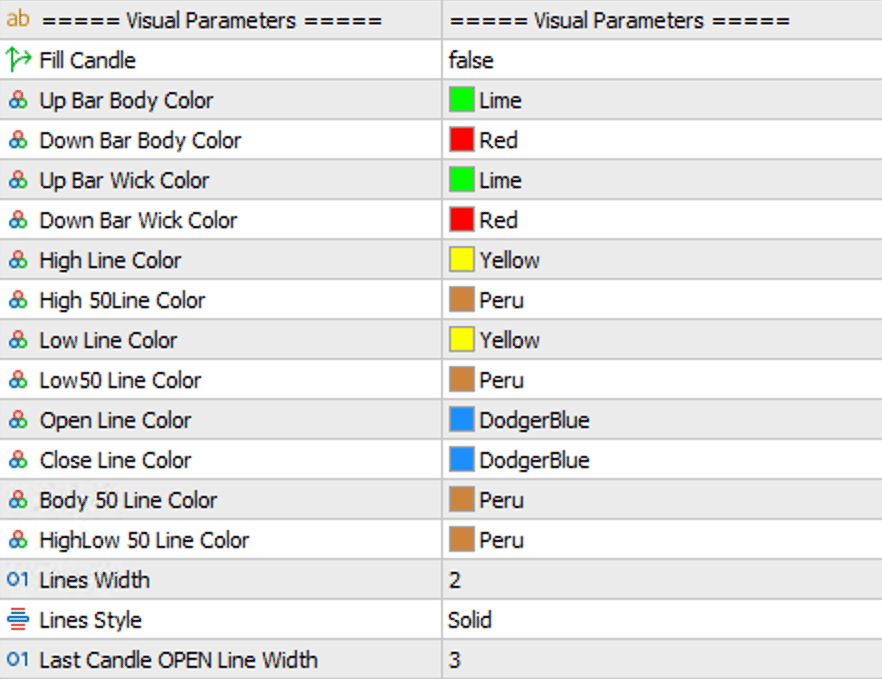
This section gives you full control over the appearance of FlowZone areas and all their elements on the chart.
- Fill Candle: Determines whether the body of the zone (the rectangle between the open and close price) should be filled with color (`true`) or if only its outline should be visible (`false`).
- Up/Down Bar Body/Wick Color: These four parameters allow you to define separate colors for:
- the body of a bullish zone,
- the body of a bearish zone,
- the wicks of a bullish zone,
- the wicks of a bearish zone.
- Line Colors (HighLineColor, OpenLineColor, etc.): This extensive group of parameters allows you to assign a unique color to each of the eight key lines that can be drawn from a zone: Open, Close, High, Low, and the 50% levels (50% of the body, 50% of the upper wick, 50% of the lower wick, 50% of the entire candle).
- Lines Width/Style: Global settings for the thickness and style (e.g., solid, dotted, dashed) of all the above lines.
- Last Candle OPEN Line Width: A special parameter that allows you to make the Open line of the most recent, still-forming zone thicker to easily identify it on the chart.
Button Parameters
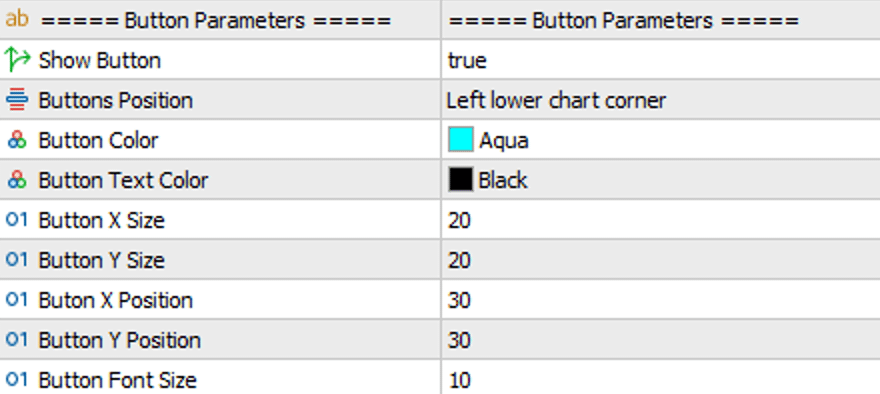
In this section, you can configure the on-chart button that serves to quickly enable or disable the visibility of all FlowZone areas.
- Show Button: Enables (`true`) or disables (`false`) the button's visibility.
- Buttons Position: Specifies in which of the four corners of the chart the button should be placed.
- Button Color and Button Text Color: Allow you to define the background and text color of the button.
- customTooltip: The text that will appear in a tooltip when you hover your cursor over the button.
- Button X/Y Size: The width and height of the button in pixels.
- Buton X/Y Position: The position (offset) of the button relative to the chosen corner, measured in pixels.
- Button Font Size: The font size for the text on the button.
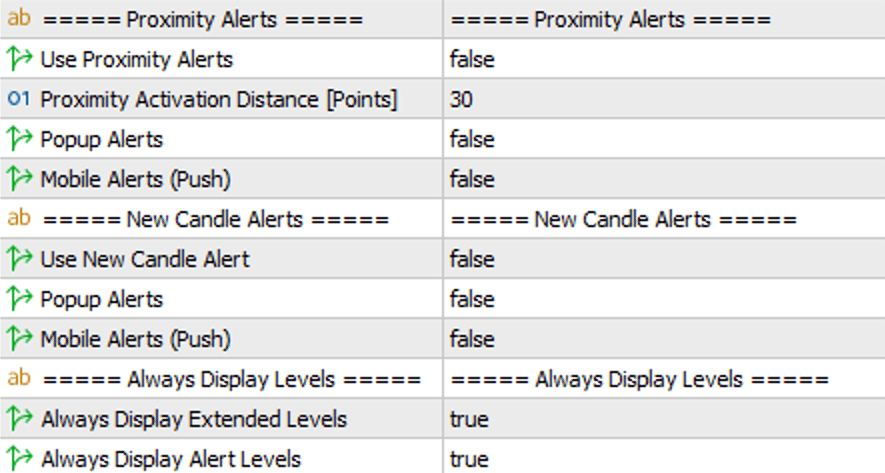
Alerts & Display Parameters
Sections for alerts and additional display options.
- Proximity Alerts: These alerts notify you when the market price approaches one of the lines drawn within a FlowZone. An alert for a specific line must first be manually activated (`CTRL` + Click on the line).
- Use Proximity Alerts: The main on/off switch for this entire feature.
- Proximity Activation Distance [Points]: Defines a buffer zone around the line (in points).
- Popup Alerts / Mobile Alerts (Push): Choose the delivery method (pop-up window or mobile notification).
- New Candle Alerts: This alert type notifies you the moment a new FlowZone is identified and drawn on the chart.
- Use New Candle Alert: The on/off switch for this specific alert type.
- Popup Alerts / Mobile Alerts (Push): Choose the delivery method for the notification.
- Always Display Levels: These parameters "pin" selected lines to the chart, making them always visible regardless of the `Look Back Days Of History` setting.
- Always Display Extended Levels: If `true`, any line you manually extend (`SHIFT` + Click) will remain visible.
- Always Display Alert Levels: If `true`, any line for which you activate an alert (`CTRL` + Click) will remain visible.

Levels Parameters
A section to define which DML levels should be analyzed. The indicator aggregates data from all levels provided here to build a single, comprehensive view of the FlowZone areas.
- DML Level Name (01-12): Fields to enter the names of up to 12 DML levels. Fill in as many as you need—empty fields will be ignored.
