
EURUSD
EURUSD is the most liquid and most frequently traded currency pair in the world. It represents the exchange rate between the euro (EUR) and the US dollar (USD). This pair plays a crucial role in the Forex market due to the significant impact of the two largest economies in the world – the European Union and the United States.

Characteristics and Specifics of the US Economy
The US dollar serves as the world’s reserve currency, and the US economy is heavily consumption-driven with a focus on technological innovation.
Key sectors influencing the dollar include finance, technology, and industry. Decisions made by the Federal Reserve regarding interest rates have a direct impact on currency rates, including EURUSD.
Additionally, the political landscape in the US, particularly during events such as presidential elections, can have a strong influence on the dollar.
Characteristics and Specifics of the European Economy
The European Union's economy, particularly the Eurozone, is diverse and composed of 19 countries with varying economic structures. The EU is a major exporter, with key sectors including industry, services, and agriculture.
The European Central Bank (ECB) controls monetary policy within the Eurozone, and its decisions on interest rates play a significant role in the EUR's value.
Fiscal policies of individual member states, as well as political events such as Brexit, can also affect the value of the euro.


Specifics of the EURUSD Pair
- High volatility: EURUSD boasts the highest liquidity in the Forex market, leading to tight spreads and high volatility during the European and US sessions.
- Macroeconomic factors: Key economic data, such as employment figures, inflation rates, and interest rate decisions in both the US and Eurozone, directly impact this pair's value.
- Global events impact: Global events, such as geopolitical conflicts, can drive demand for the dollar as a safe-haven currency.
Summary
EURUSD is one of the most traded currency pairs in the world, representing the economies of the United States and the Eurozone.
The pair is characterized by high liquidity and stability, making it a popular choice among traders of all levels. EURUSD is heavily influenced by macroeconomic data, political decisions, and differences in monetary policies between the European Central Bank (ECB) and the Federal Reserve (Fed).
Key aspects of trading EURUSD include analyzing monetary policies, economic indicators, and shifts in global politics that can affect the relationship between the euro and the US dollar.
The EURUSD exchange rate reflects the differences in strength between the two economies, making it a key indicator of global economic trends.

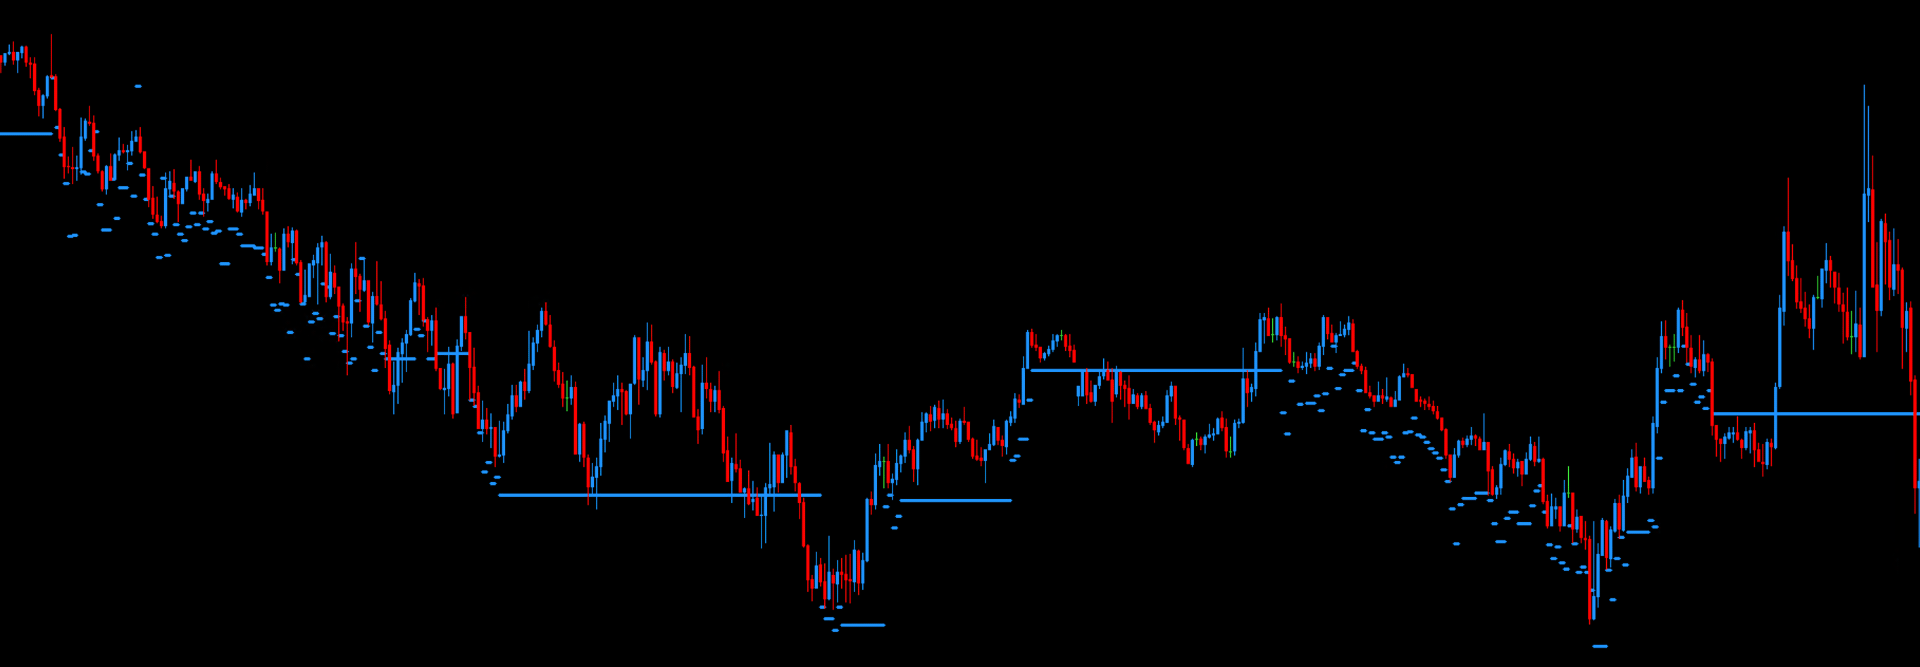
Example DML levels:
SkyBlue - Daily Support & Resistance
The SkyBlue levels are daily support and resistance levels published around 6:00 AM GMT. These levels are determined based on liquidity flow analysis and key market data, serving as a tool for identifying short-term price movements.
You can find more about SkyBlue levels here.
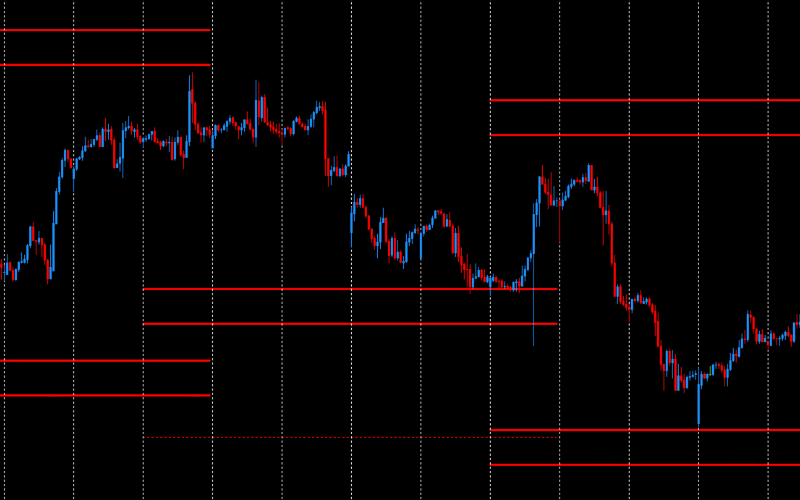
Red - Weekly Support & Resistance
The Red levels are weekly supports and resistances. They appear on the chart on Wednesday afternoons and remain valid for the following week. Red levels consist of a total of six horizontal lines: three above the price and three below. The main Red levels, known as RedEx, are located at the extreme positions - both at the bottom and top. Approximately one-quarter of the distance between the lower and upper RedEx levels, the Red levels create a zone marked by two bold lines, both above and below the price.
You can find more about Red levels here.
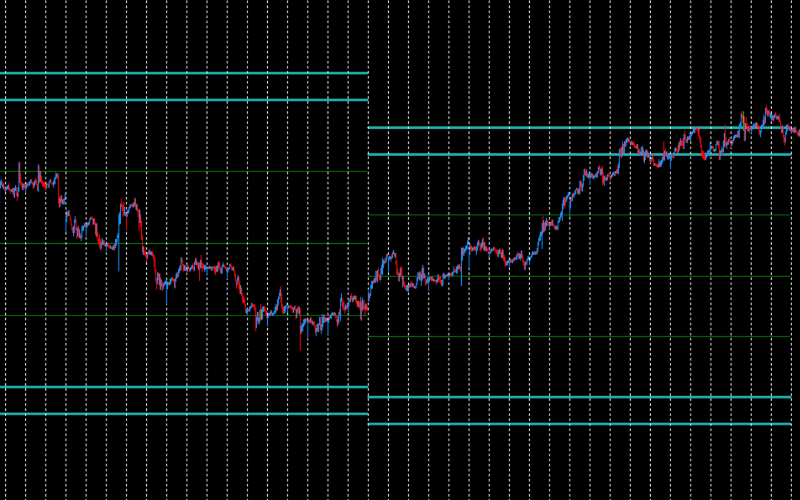
SeaGreen - Monthly Support & Resistance
SeaGreen levels are monthly supports and resistances set at the beginning of each calendar month. The price rarely reaches these levels, but when it does, it usually either changes direction long-term or consolidates at that level. This makes it an ideal level for investors and traders who position their trades over a longer time frame.
You can find more about SeaGreen levels here.
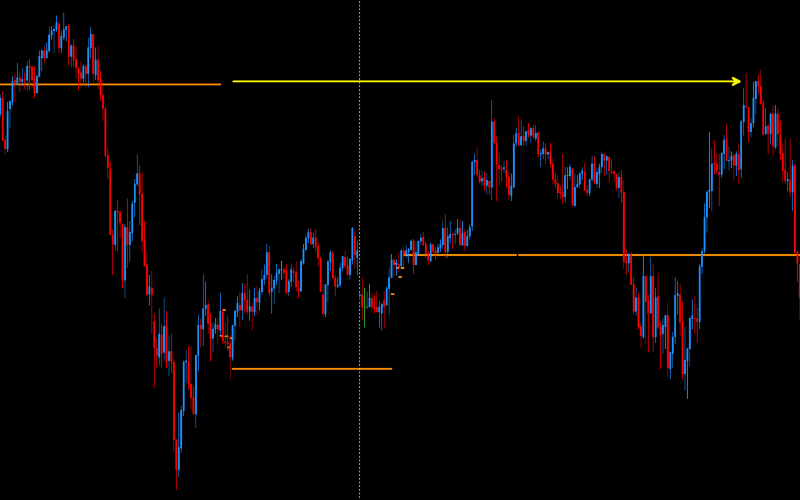
DarkOrange - precise price reactions
DarkOrange levels are closely linked to Violet levels, which are updated every hour, unlike DarkOrange levels, which are updated every 5 minutes. Both the data sources and calculation algorithms are identical. However, the more frequent 5-minute recalculations for DarkOrange levels have allowed the discovery of unique setups and models, as well as the observation of many anomalies unavailable for trading on Violet levels.
You can find more about DarkOrange levels here.
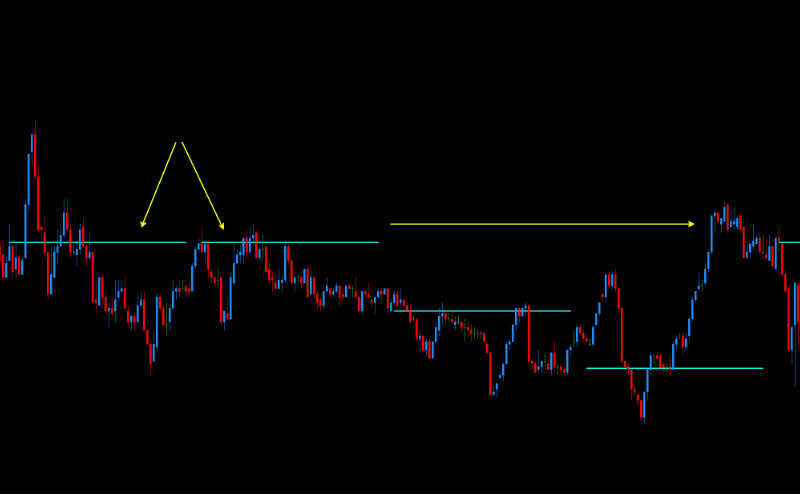
Aqua - DML Floating Levels
Aqua levels, similar to Violet levels, are retrieved every hour, although their characteristics are quite different. Violet levels, for reference, typically hold one level throughout most of the day, then shift to a new level in the evening after the Flow Zone (FZ). In contrast, Aqua levels usually appear near the current price level.
You can find more about Aqua levels here.
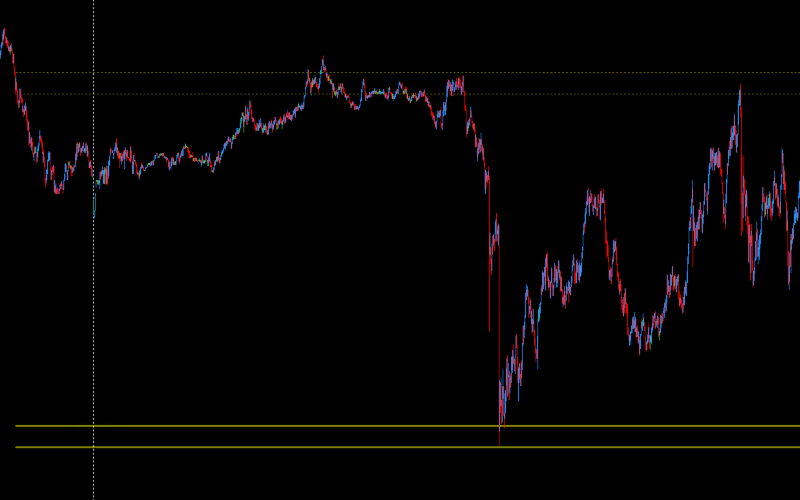
Olive - Daily Support and Resistance
Olive levels are generated once a day, around 19:00 GMT. This level consists of three zones. The middle zone is located around the price level at 19:00 GMT. The other two zones are located above and below the middle zone, at equal distances from it. The range of these distances varies daily and indicates the potential movement dynamics for the next day. The lower zone is a very strong support for the next trading day, while the upper zone is a strong resistance for the next trading day.
You can find more about Olive levels here.
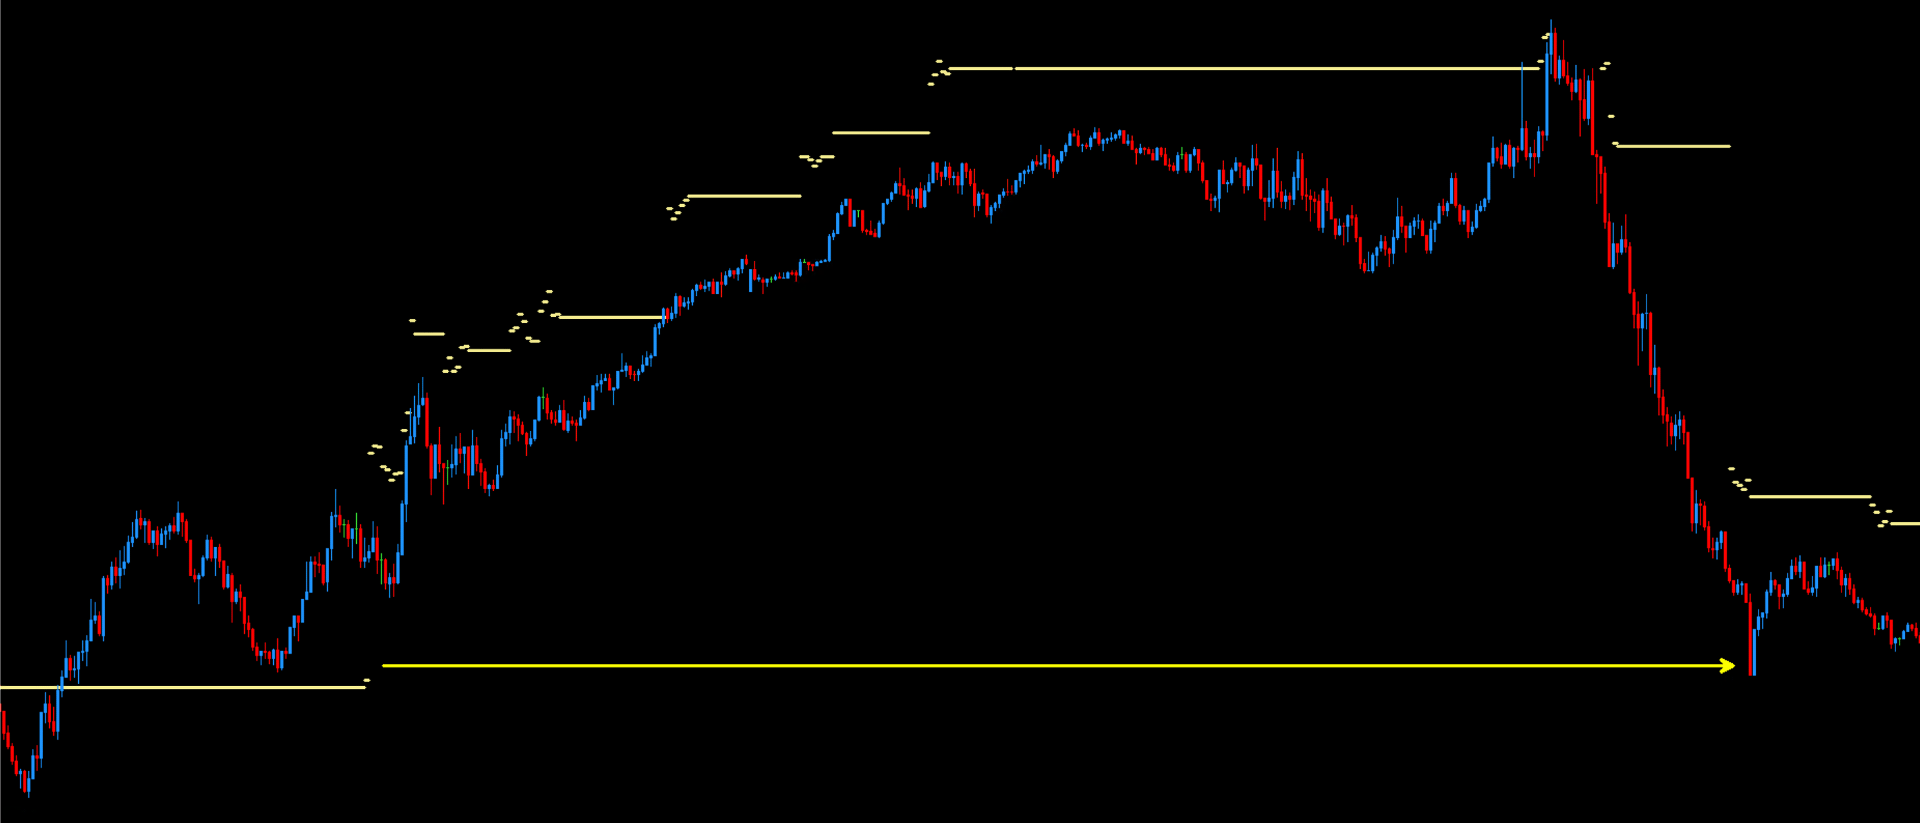
Khaki – Dynamic Supports and Resistances
Khaki levels on EURUSD are key resistance levels that play an important role in trading this currency pair. Exceeding the zone defined by these levels suggests that the price should return to them. Particularly important is the zone between the last Flow Zone (FZ), which appears in the morning, and 11:00 AM GMT. Levels ending after 12:00 PM GMT are also settled, but experience shows that treating Khaki levels as resistances until 11:00 AM is safer and has significantly better repeatability. The repeatability of returns to these levels is over 90%.
You can find more about Khaki levels here.
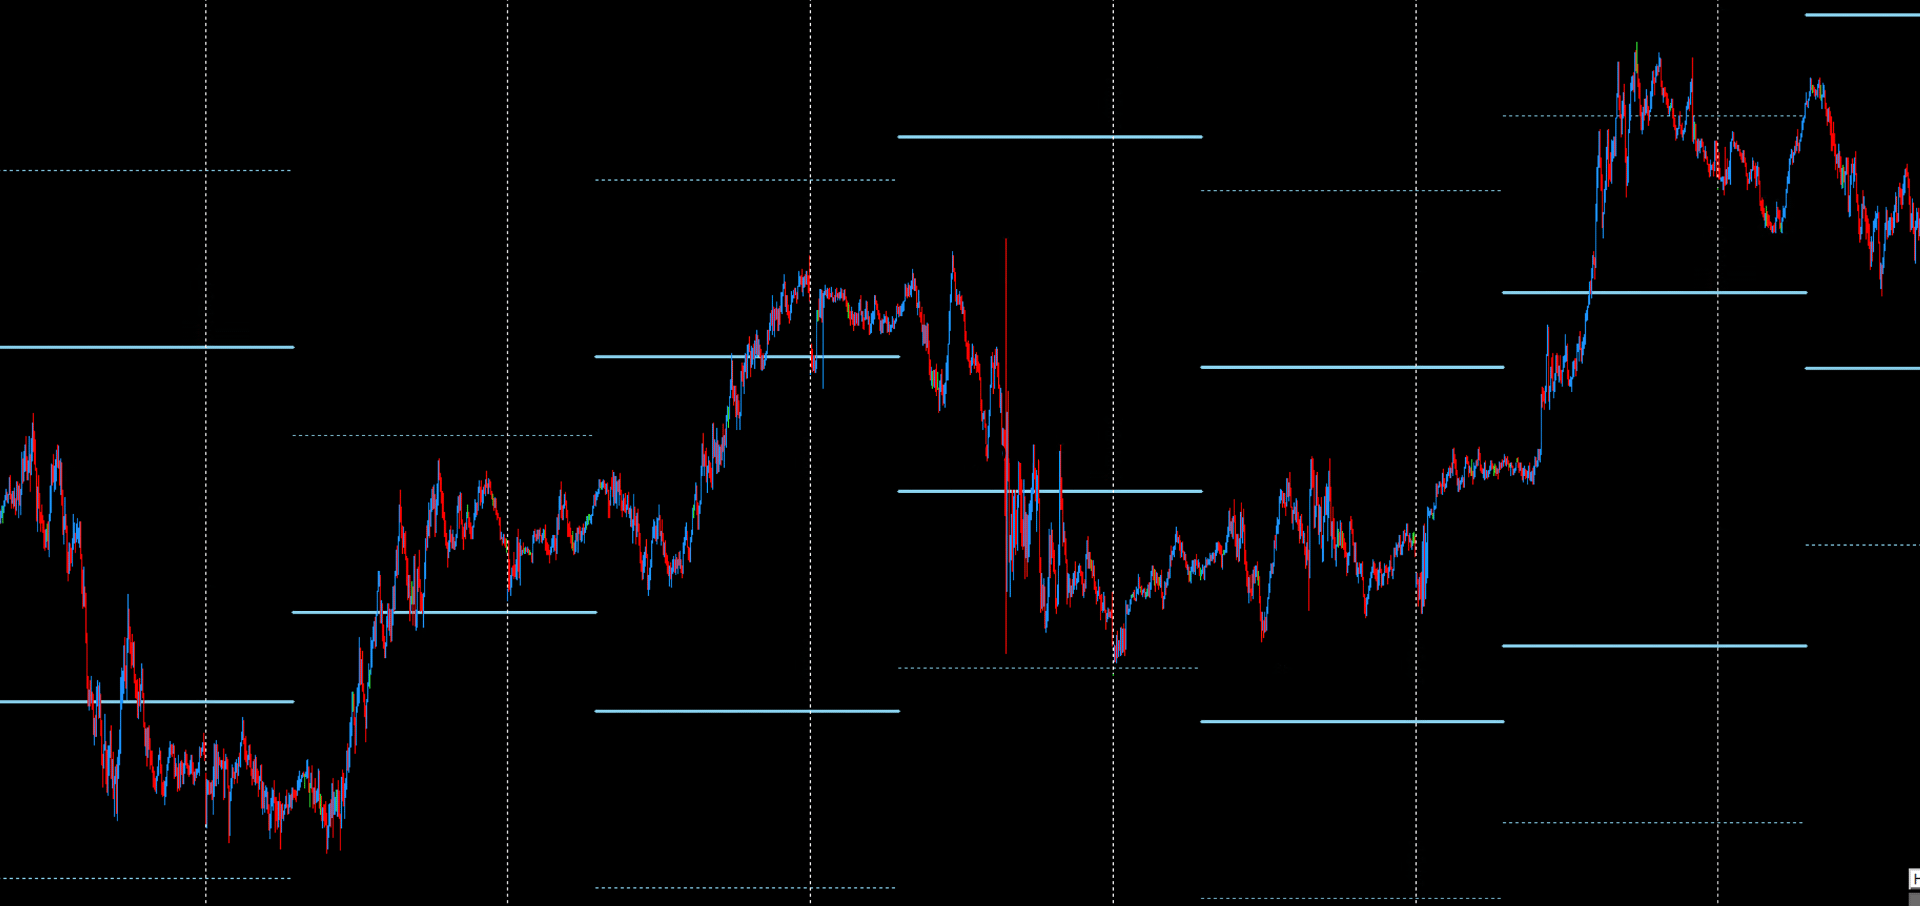
DodgerBlue - Completed DML Levels
DodgerBlue levels, offered by DeepMarketLevel.com, are a unique tool for analyzing the forex market. Their distinctiveness lies in precisely identifying key price levels that statistical models recognize as significant for price movements within specific timeframes.
You can find more about DodgerBlue levels here.