
DML Levels Reveal What Standard Methods Can't See
In today's financial markets, an edge is no longer found merely in tracking repetitive patterns, but in the ability to identify and interpret anomalies - events that defy the rules. While most analytical models focus on high probability patterns (with 90-95% repeatability), at Deep Market Level, we concentrate on the crucial 5% that constitute the exceptions. It is these exceptions that often carry the most valuable information about future price dynamics.
In this article, we present a case study of a recent anomaly on the USD/CHF currency pair, showing how precise data from DML levels allows for a deeper understanding of market structure.
The Key Moment: Identifying an Anomaly in the Market Structure
Every market has its internal logic and cyclicality. Our DML levels are designed to reflect this logic. One of the key assumptions is the stability of certain price levels within specific time windows. When this stability is breached, we are dealing with an anomaly.
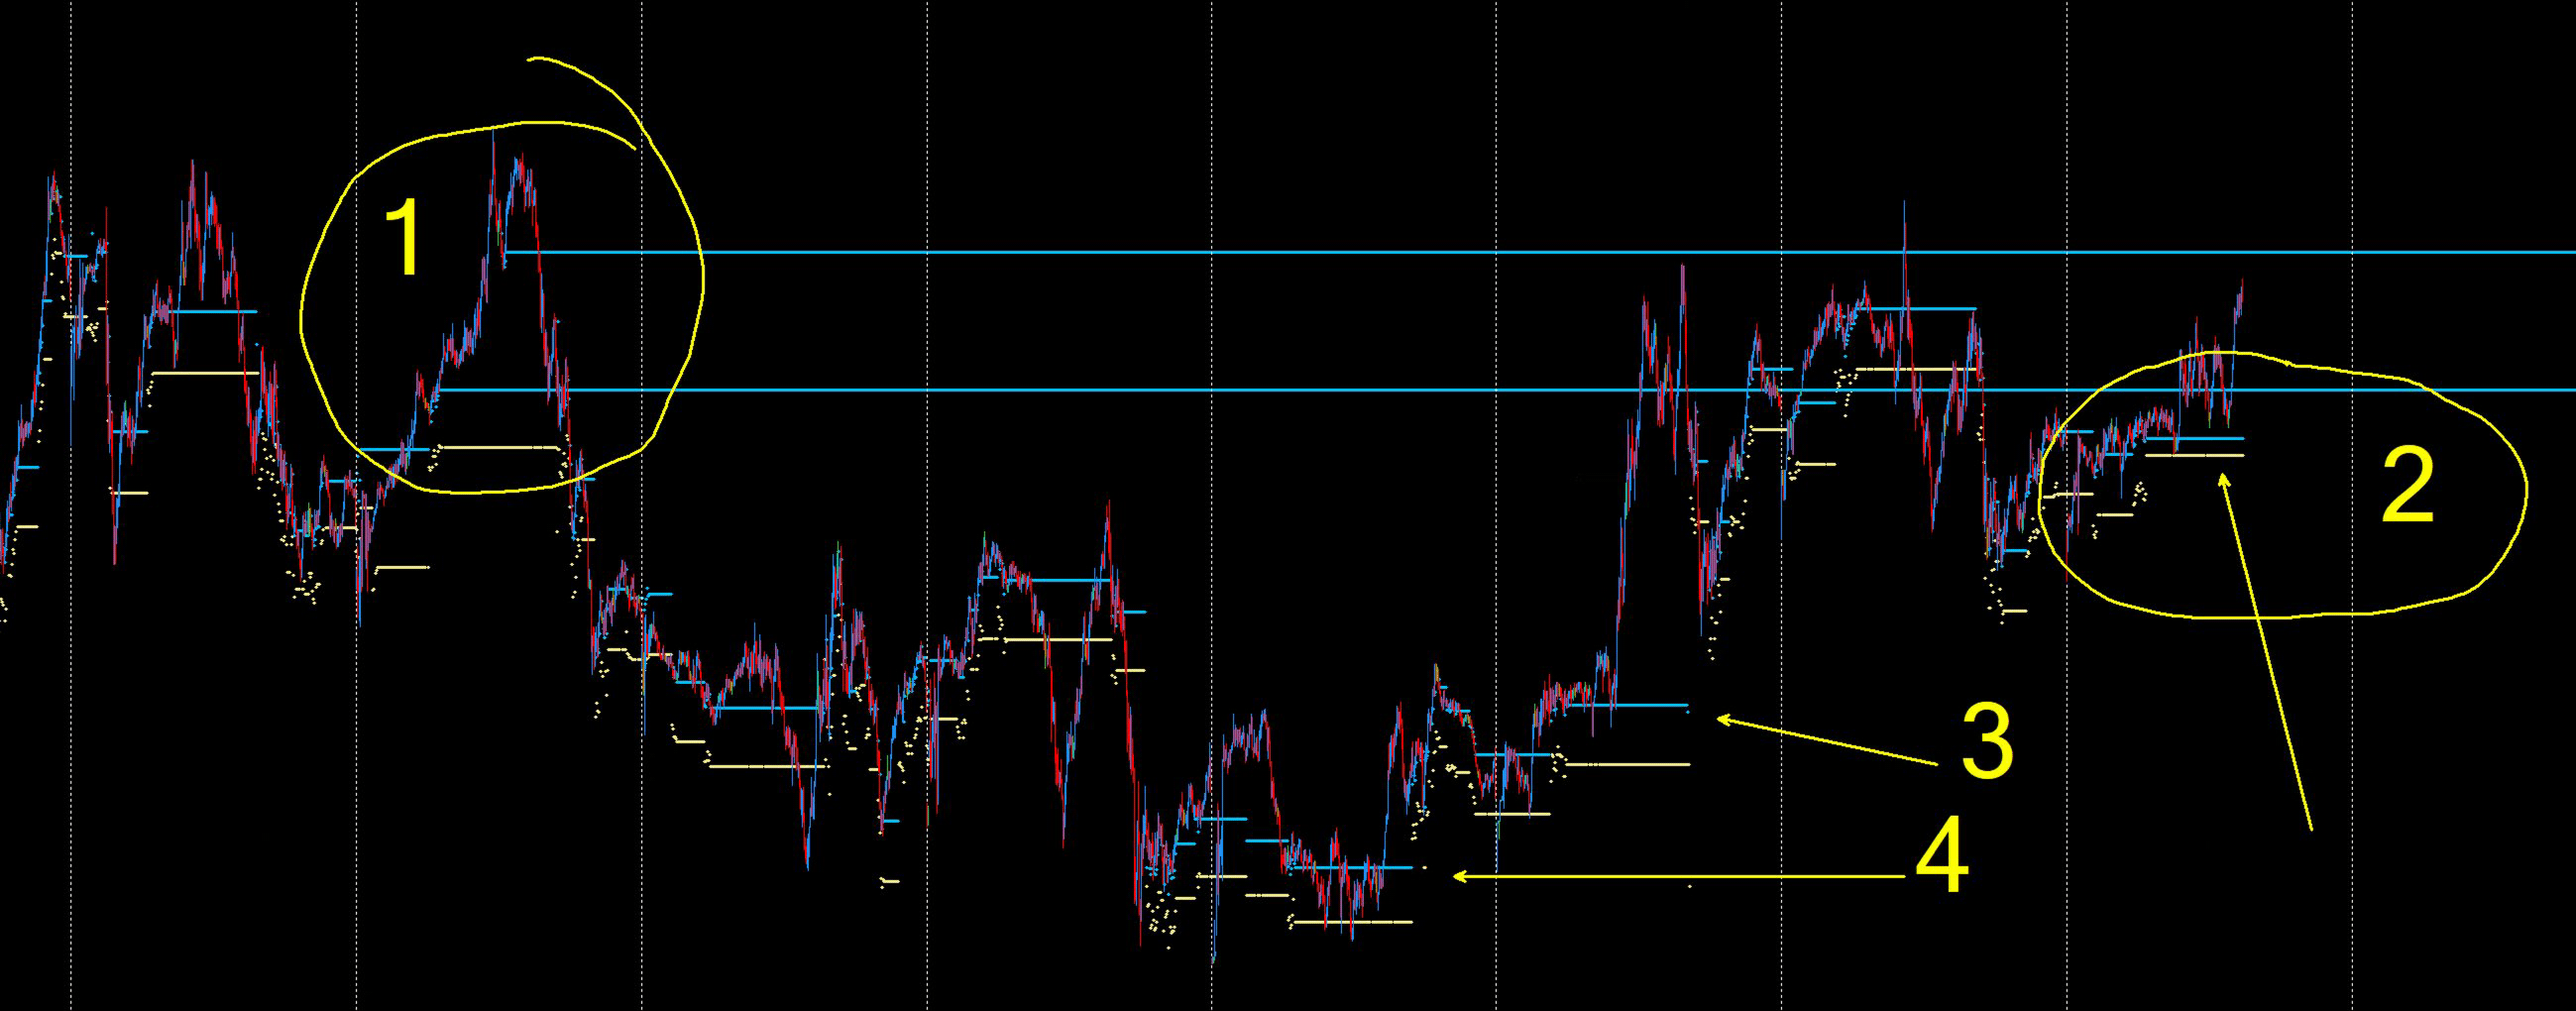
Point 1 on the chart shows exactly such an event. A few days ago, during the key European session timeframe between 7:00 AM and 3:00 PM (GMT+3), a break in the continuity of the DeepSkyBlue2 level occurred. Under normal conditions, this level should have remained intact, serving as a stable point of reference. Its breach was a signal that something non standard had happened in the market structure, leaving a lasting footprint in the market's "memory." Yesterday and the day before, we observed retests of this important zone, confirming its significance.

The Echo of the Past: How the Anomaly Influences Current Price
The financial market has a memory. Unusual events, like the anomaly described, create price zones that become areas of heightened reactivity in the future.
Point 2 on the chart illustrates this phenomenon. Currently, the price of the USDCHF pair has returned to the area defined by the earlier anomaly. What is particularly interesting is that this phenomenon is entirely unique to this currency pair—we have not observed similar behavior on other instruments involving the US dollar.
Thanks to DML, we were able to precisely define this zone: the 0.8040-0.8042 range. This is an extremely narrow area that has now become a key observation point for an analyst. If you do not have access to our levels, it is worth noting these values - their importance may become apparent in the near future.

Context is Key: Comparing the Anomaly with the Standard Model
To fully grasp the significance of an anomaly, it must be compared with what we would expect within a standard market model.
- Point 3 on the chart: According to the repeatable DML model, a natural move for the market would be to return and test the continuous DeepSkyBlue2 level from three days ago. This is a high probability scenario under typical conditions.
- Point 4 on the chart: The model also indicates the possibility of a retest of an older level from four days ago. However, the probability of this event is significantly lower. Why? Because the price was there around 3:00 PM, near the end of the key time window, which weakens the magnetic pull of this level.
The anomaly (points 1 and 2), however, introduces an entirely new context to this analysis. It can act as a stronger gravitational center for the price, potentially altering or delaying the realization of the standard scenarios (points 3 and 4).

Conclusion: The Edge Gained from Understanding the Exceptions
Analyzing market anomalies is a shift from reactively following patterns to proactively understanding market structure. Instead of asking "what is happening now?", we begin to understand "why is it happening at this specific location?".
he USD/CHF case study perfectly demonstrates that:
- Anomalies leave lasting footprints, creating zones of key importance.
- Precise data (like DML) allows for the exact definition of these zones.
- The context of an anomaly can change the interpretation of standard, repeatable models.
This approach does not generate trading signals. Instead, it provides a unique perspective and deep insight into the mechanics of the market, which is the foundation for making informed decisions.
This analysis is a market commentary based on the DeepMarketLevel methodology and does not constitute investment advice or a trading recommendation.