
USD/JPY at a Critical Juncture
The USD/JPY currency pair has arrived at one of its most interesting technical points in months. The price has reached a rarely seen monthly resistance level determined by the DeepMarketLevel (DML) methodology, while a powerful support zone, formed by a convergence of three distinct market phenomena, has materialized below. The situation is further energized by the upcoming release of the FOMC meeting minutes, which could act as a catalyst for a sharp price movement.
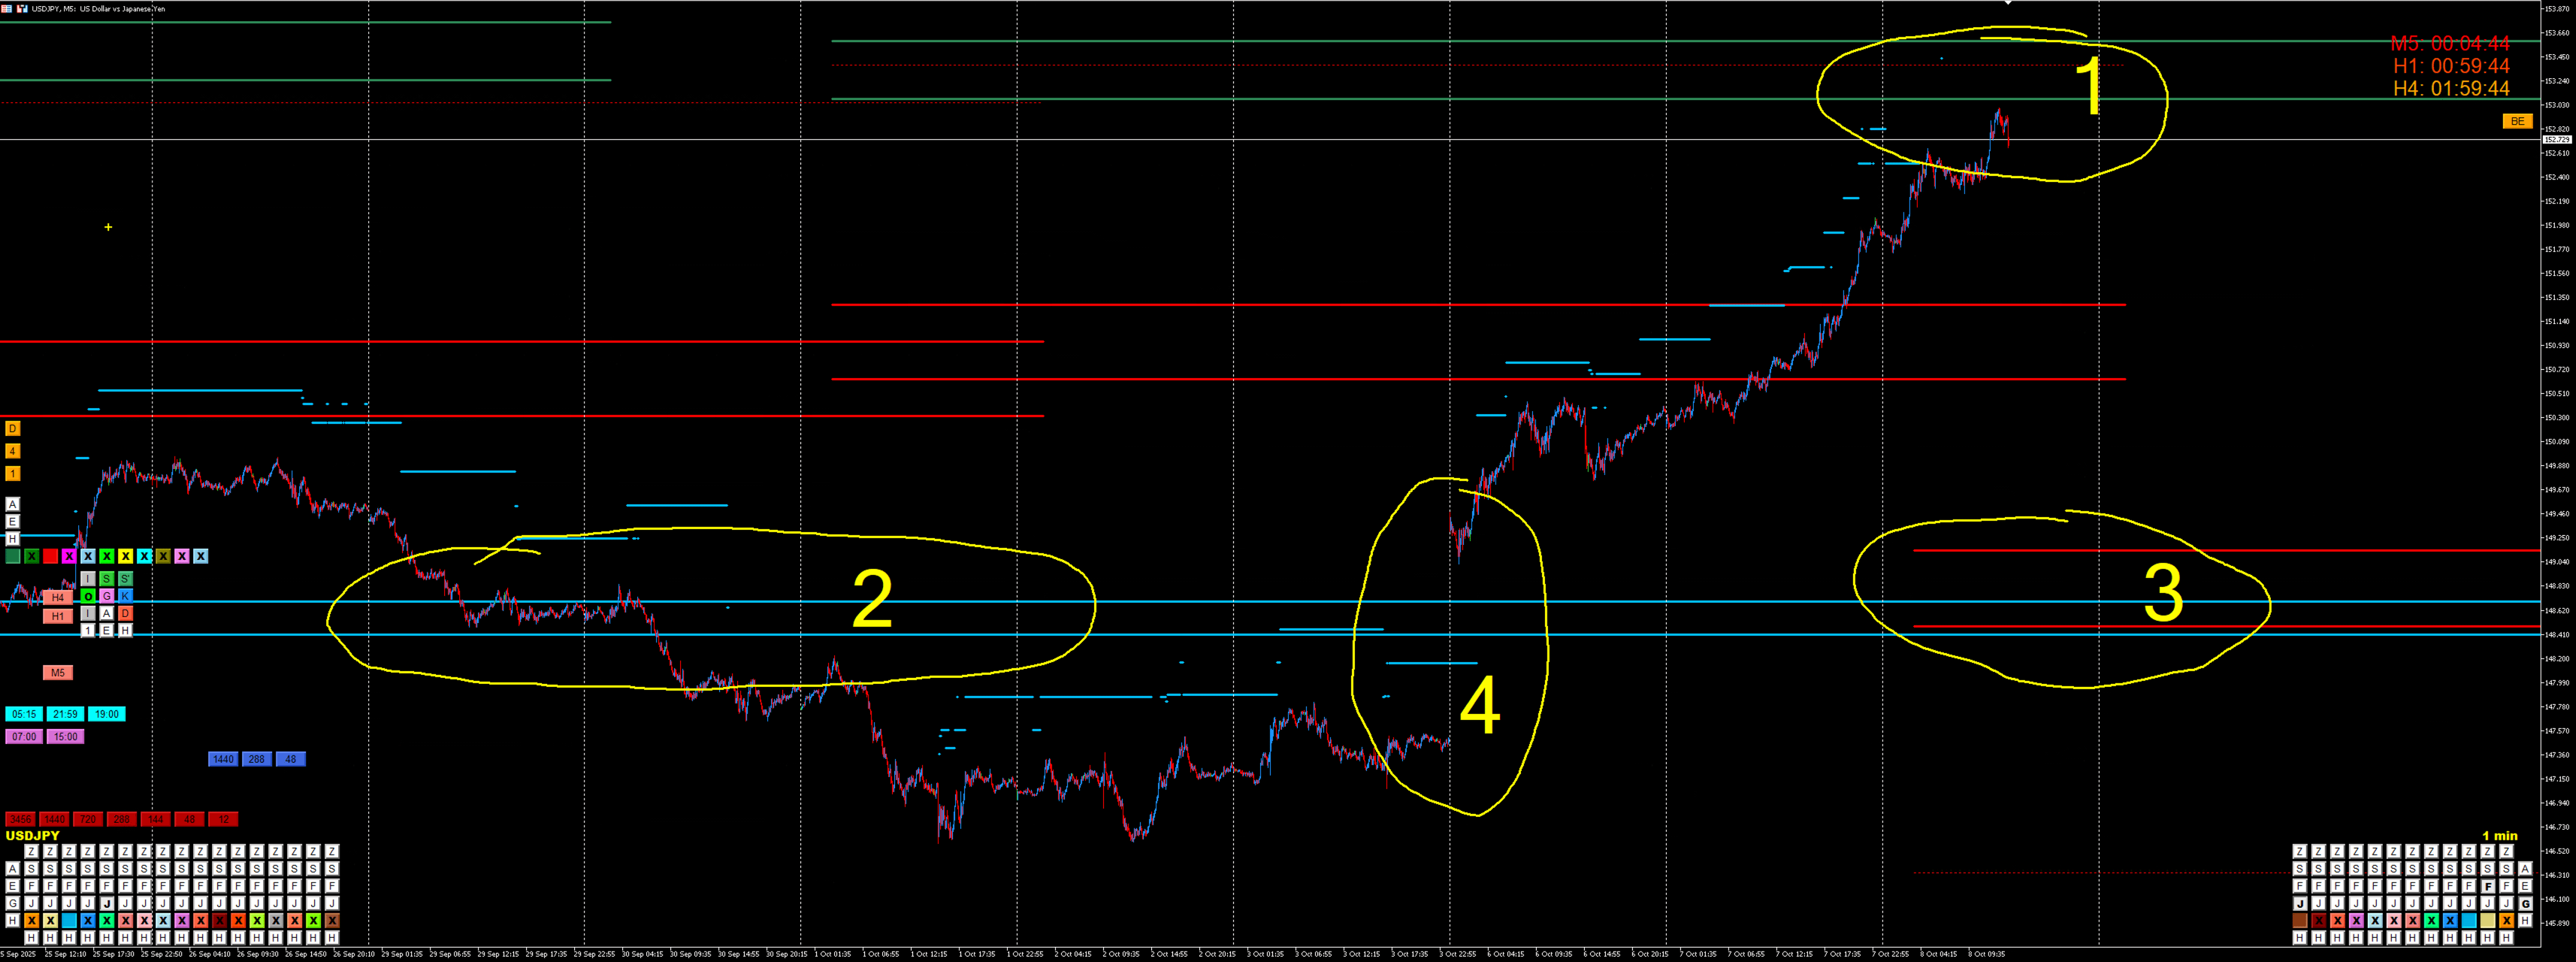
The Upper Boundary: The Historical Monthly Resistance
The current USD/JPY price is hovering around a key monthly resistance level, marked in SeaGreen (1) on the DML charts. Monthly levels, due to their nature of being based on wide-interval data, are very rarely reached by the market. Every time the price approaches such a level, it is a noteworthy event, as these zones have historically often initiated significant corrections or trend reversals. We are therefore at a point where selling pressure could naturally increase.
The Lower Magnet: A Unique Confluence of Three Elements
What makes the current situation truly exceptional is the formidable support zone that has formed significantly lower. It consists of three independent elements that perfectly converge in both price and time.
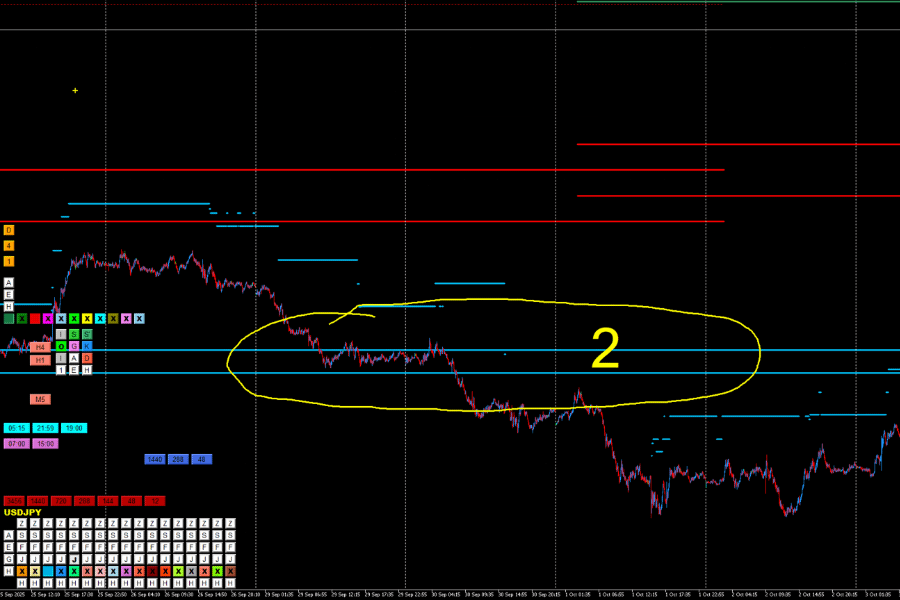
A Historical Data Anomaly (2)
Several weeks ago, a significant anomaly formed at levels that act as dynamic supports and resistances (DeepSkyBlue2). Structures of this type often act as a "magnet" for the price, which in the future tends to "retest" them, and this could be a very significant reaction level in the future.
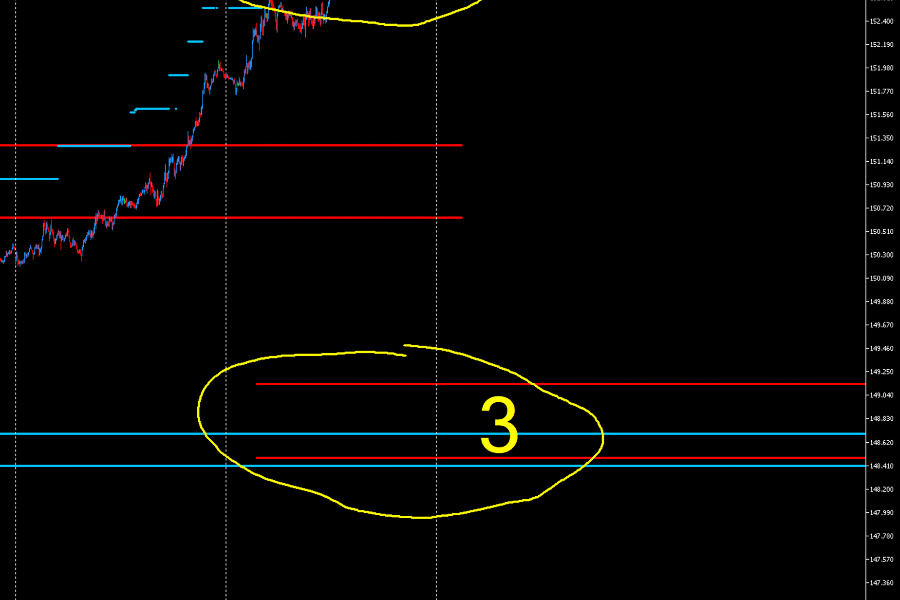
Current Weekly Supports (3)
The newly established support levels on the weekly "interval" (red lines on the chart) are located at the exact same price area as the aforementioned anomaly. This creates a powerful confluence, reinforcing the importance of this zone as a potential floor for any corrective move. It is worth recalling that DML weekly levels are determined on Wednesdays and we usually publish them before the start of the US session.
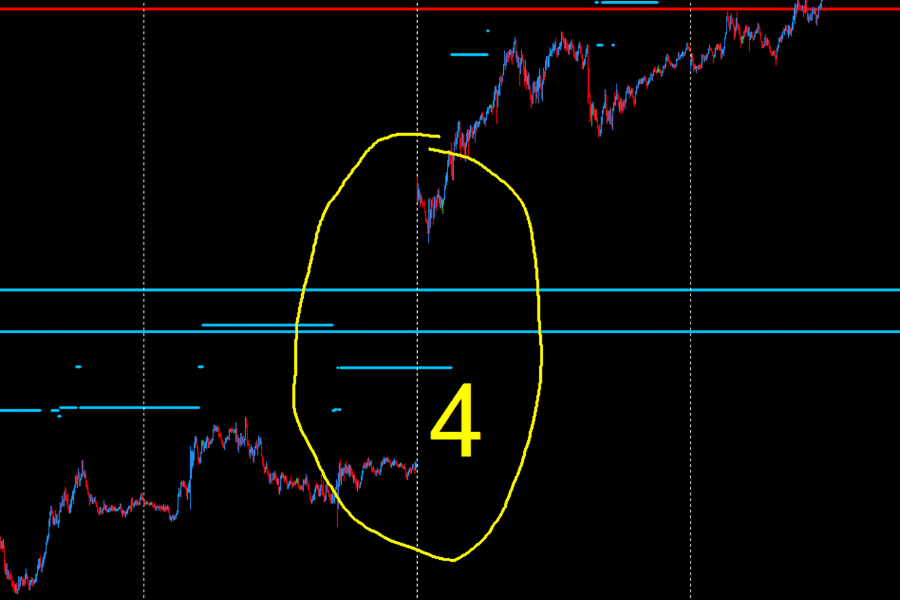
An Unclosed Price Gap (4)
To top it off, the entire support zone described above is situated perfectly inside the price gap that formed during Monday's market open. Price gaps, especially unclosed ones, are often viewed by the market as targets for future price action.
The Catalyst: The FOMC Meeting Minutes
The market is in a state of technical tension - caught between a strong resistance from above and a magnetic support zone from below. In such conditions, a fundamental impulse is often needed to resolve the battle. The release of the FOMC minutes is precisely the kind of event that can inject volatility into the market. Investors will be scrutinizing the document for clues about the Fed's future monetary policy, which will directly impact the strength of the U.S. dollar and could initiate a move towards one of the described zones.
Summary and Outlook
We are witnessing a textbook example of market tension building on the USD/JPY pair. On one hand, we have a historical resistance that could halt further advances. On the other, there is an incredibly strong, triple-threat support zone that could attract the price and become the foundation for the next upward impulse. Whether the price will first "settle" the lower zone and close the gap, or react strongly to it, leaving it open, is the key question for the coming days. We will likely find out the answer very soon.
This analysis is a market commentary based on the DeepMarketLevel methodology and does not constitute investment advice or a trading recommendation.