
AUDUSD
The AUDUSD currency pair is one of the most traded pairs in the Forex market. It represents the exchange rate between the Australian dollar (AUD) and the US dollar (USD). The Australian dollar is considered a commodity currency, meaning its value is strongly tied to commodity prices, such as gold and iron ore, of which Australia is a major exporter.
The US dollar, on the other hand, is the world's most dominant currency, often seen as a safe-haven asset. The value of AUDUSD is frequently shaped by the monetary policies of the US Federal Reserve (Fed) and the Reserve Bank of Australia (RBA).

Characteristics and Specifics
- High volatility: AUDUSD is known for its high volatility, especially during the release of macroeconomic data from Australia and the US.
- Strong link to commodities: This pair's price often reacts to changes in the prices of commodities exported by Australia.
- Interest rate differentials: The value of this pair is often influenced by the interest rate differences between the US and Australia.
- External factors: China’s policies, being Australia’s largest trading partner, significantly impact the AUDUSD exchange rate.
Summary
The AUDUSD currency pair offers many trading opportunities due to its volatility and the diverse factors affecting its value.
The combination of commodity prices, monetary policy, and macroeconomic events from both sides of the Pacific makes it particularly attractive to traders looking for short- and medium-term trading opportunities.

Example DML levels:
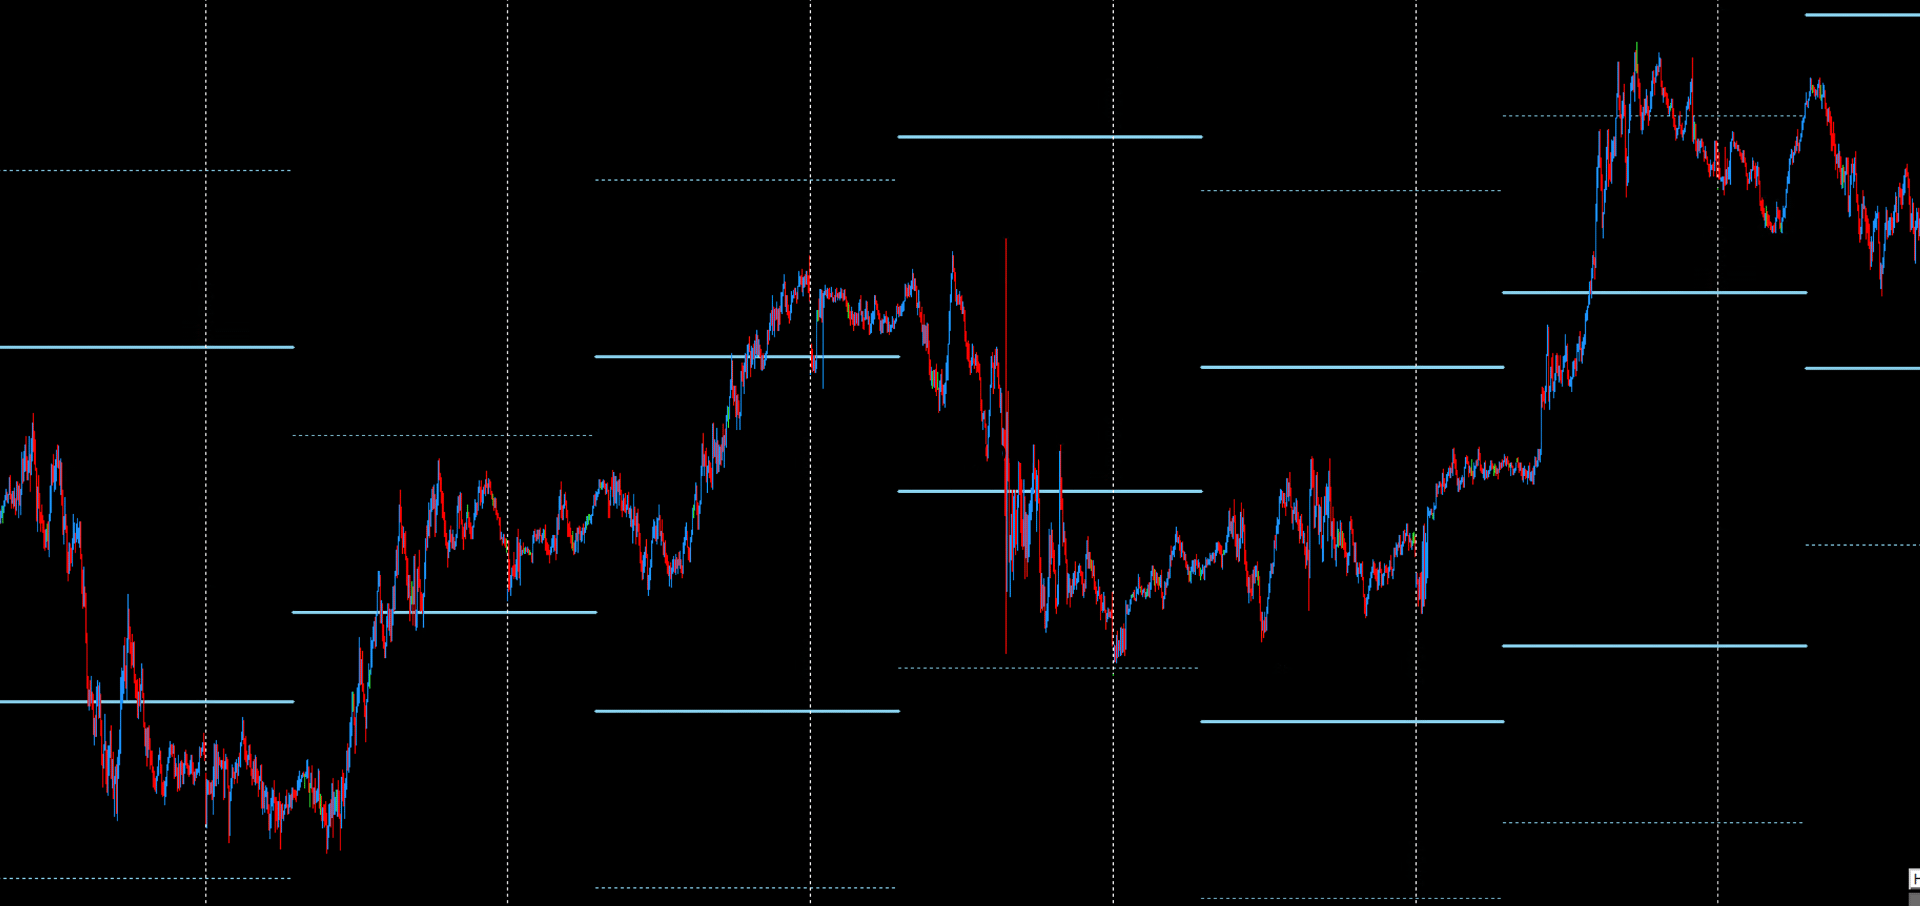
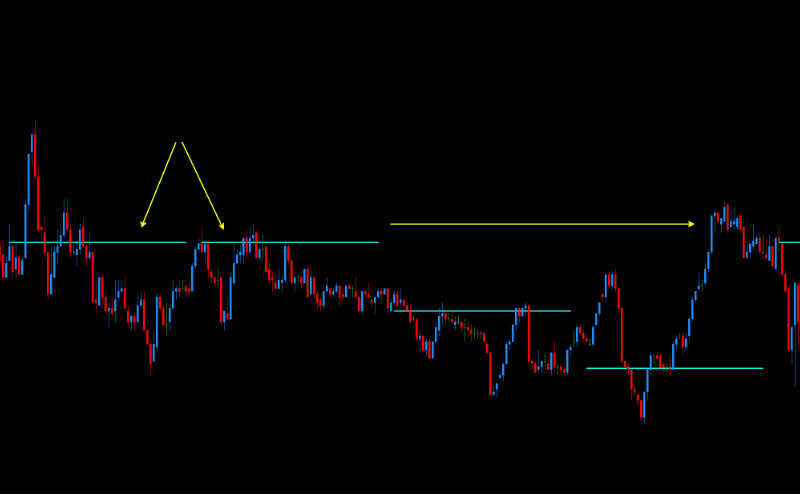
SkyBlue - Daily Support & Resistance
The SkyBlue levels are daily support and resistance levels published around 6:00 AM GMT. These levels are determined based on liquidity flow analysis and key market data, serving as a tool for identifying short-term price movements.
You can find more about SkyBlue levels here.
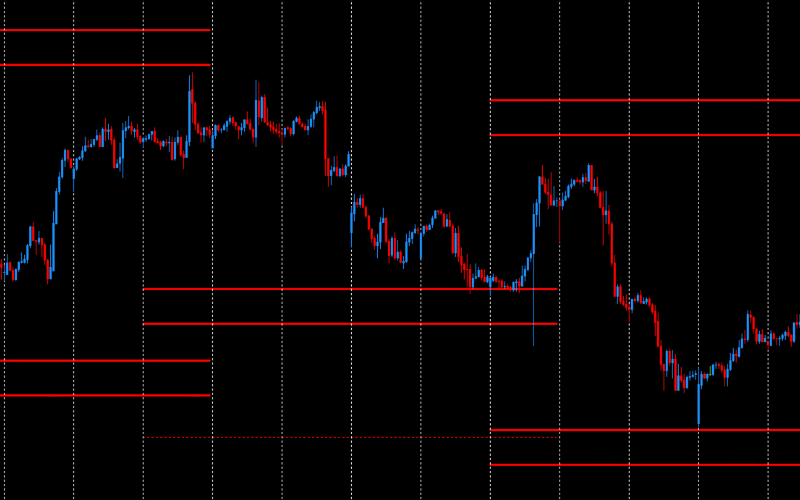
Red - Weekly Support & Resistance
The Red levels are weekly supports and resistances. They appear on the chart on Wednesday afternoons and remain valid for the following week. Red levels consist of a total of six horizontal lines: three above the price and three below. The main Red levels, known as RedEx, are located at the extreme positions - both at the bottom and top. Approximately one-quarter of the distance between the lower and upper RedEx levels, the Red levels create a zone marked by two bold lines, both above and below the price.
You can find more about Red levels here.
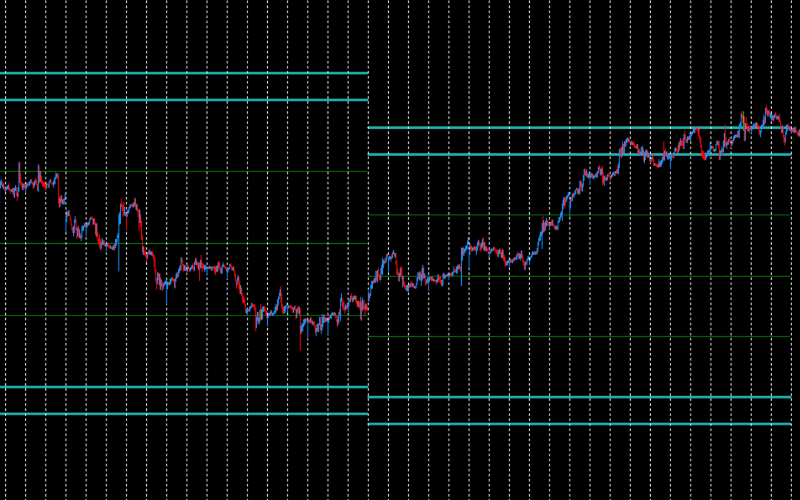
SeaGreen - Monthly Support & Resistance
SeaGreen levels are monthly supports and resistances set at the beginning of each calendar month. The price rarely reaches these levels, but when it does, it usually either changes direction long-term or consolidates at that level. This makes it an ideal level for investors and traders who position their trades over a longer time frame.
You can find more about SeaGreen levels here.
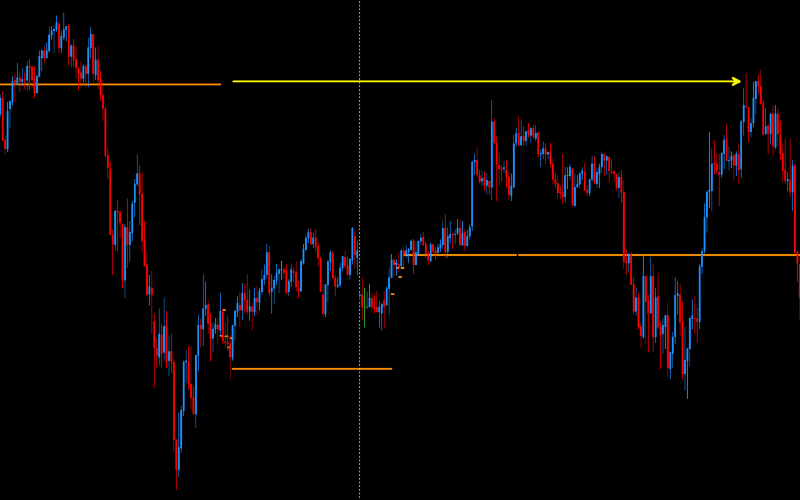
DarkOrange - precise price reactions
DarkOrange levels are closely linked to Violet levels, which are updated every hour, unlike DarkOrange levels, which are updated every 5 minutes. Both the data sources and calculation algorithms are identical. However, the more frequent 5-minute recalculations for DarkOrange levels have allowed the discovery of unique setups and models, as well as the observation of many anomalies unavailable for trading on Violet levels.
You can find more about DarkOrange levels here.
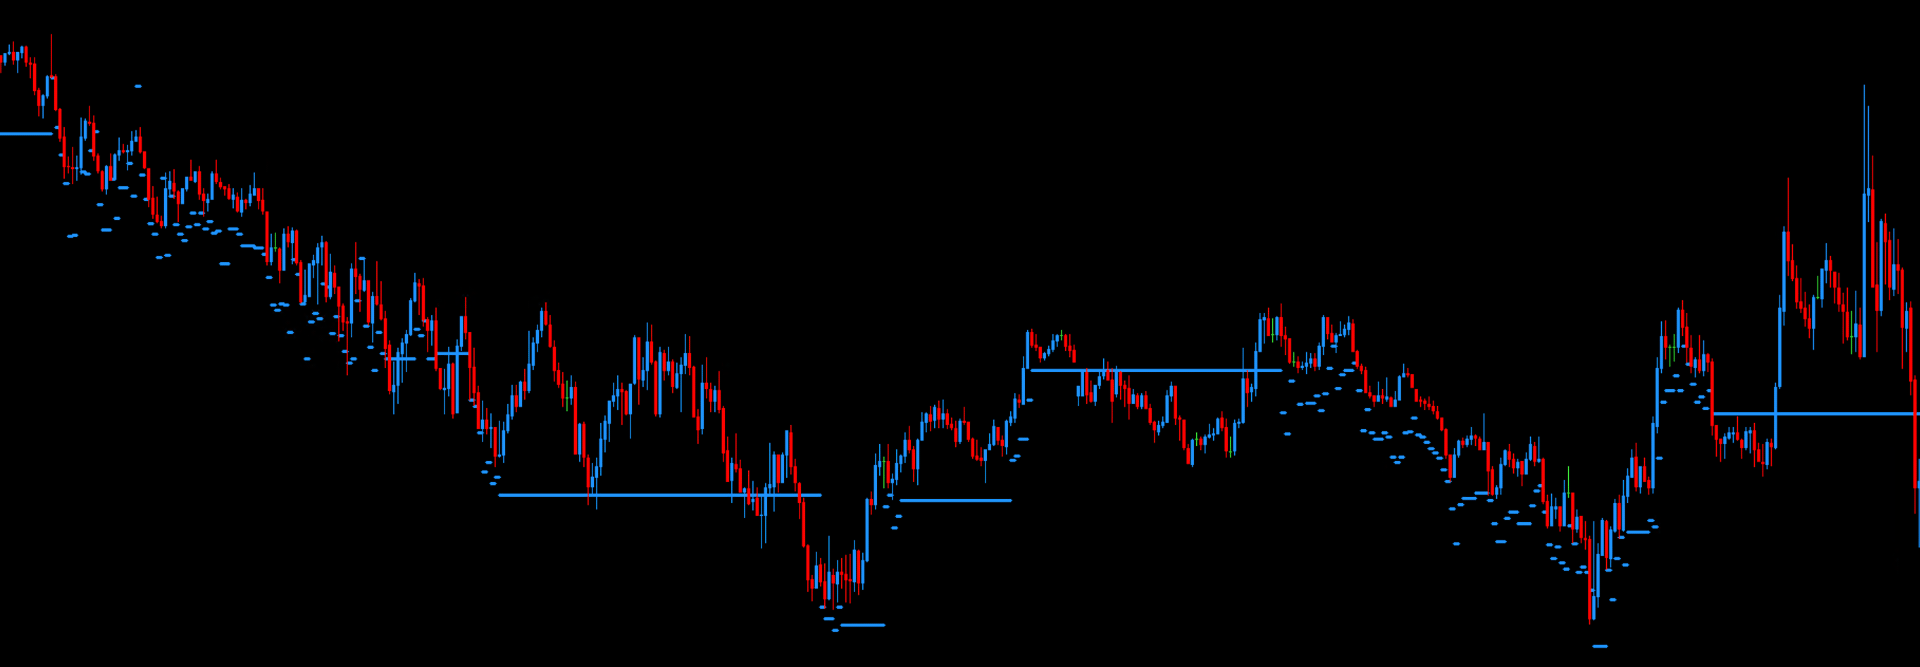
Aqua - DML Floating Levels
Aqua levels, similar to Violet levels, are retrieved every hour, although their characteristics are quite different. Violet levels, for reference, typically hold one level throughout most of the day, then shift to a new level in the evening after the Flow Zone (FZ). In contrast, Aqua levels usually appear near the current price level.
You can find more about Aqua levels here.
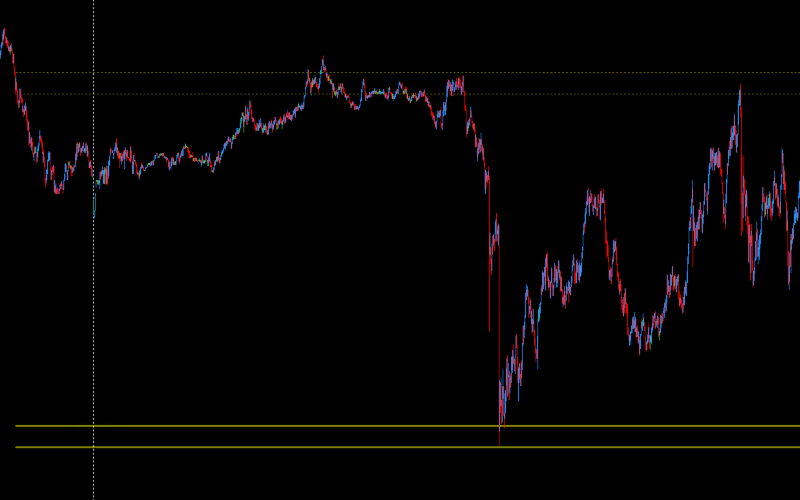
Olive - Daily Support and Resistance
Olive levels are generated once a day, around 19:00 GMT. This level consists of three zones. The middle zone is located around the price level at 19:00 GMT. The other two zones are located above and below the middle zone, at equal distances from it. The range of these distances varies daily and indicates the potential movement dynamics for the next day. The lower zone is a very strong support for the next trading day, while the upper zone is a strong resistance for the next trading day.
You can find more about Olive levels here.
DodgerBlue - Completed DML Levels
DodgerBlue levels, offered by DeepMarketLevel.com, are a unique tool for analyzing the forex market. Their distinctiveness lies in precisely identifying key price levels that statistical models recognize as significant for price movements within specific timeframes.
You can find more about DodgerBlue levels here.