
JUMP Signal Visualization on Your Chart!

We are excited to present another update to our specialized tool, DML EA JUMP & FLIP. Listening to the needs of traders who value precision and transparency, we have introduced a new feature: visualization of JUMP signals directly on the chart.
From now on, you can precisely track every moment the robot identifies a potential trade setup. The feature works reliably during historical analysis in the Strategy Tester, as well as in real-time on demo and live accounts.
What is JUMP Signal Visualization?
The new feature draws colored arrows on the chart precisely on the candle where a JUMP signal was generated. It's a simple yet incredibly powerful analytical tool that allows you to assess at a glance:
- The place and time of the signal's occurrence.
- The market context in which the signal appeared (e.g., during consolidation, after a dynamic move).
- The frequency of setup generation by the strategy.
The arrow's color automatically matches the color of the DML level that was the source of the signal, which further simplifies analysis and maintains visual consistency. It's worth noting that the arrow visualization in this EA works similarly to the feature in our DML MultiButton Panel - our most advanced indicator, which is also available for free download in the client panel.
Full Customization – Tailor the Appearance to Your Needs
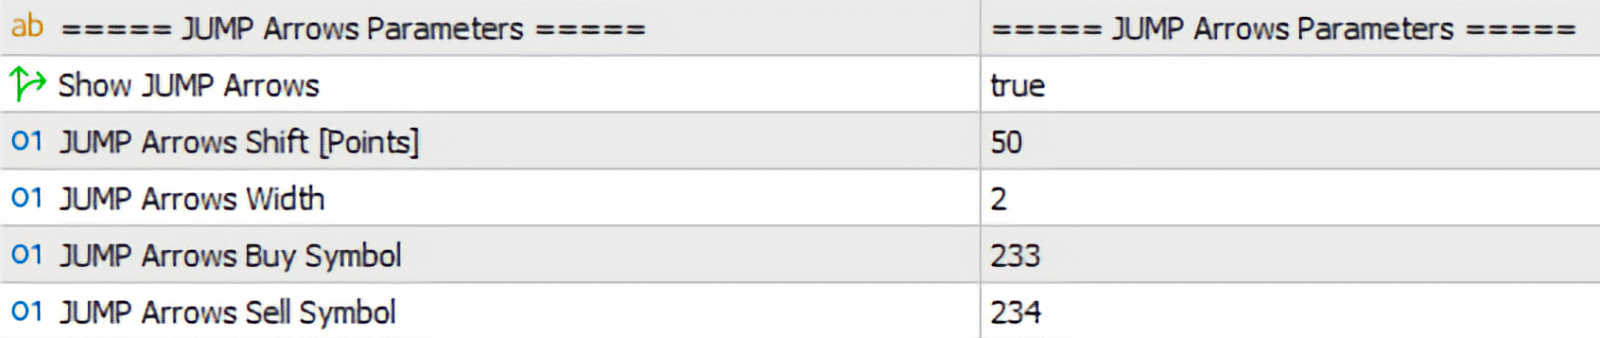
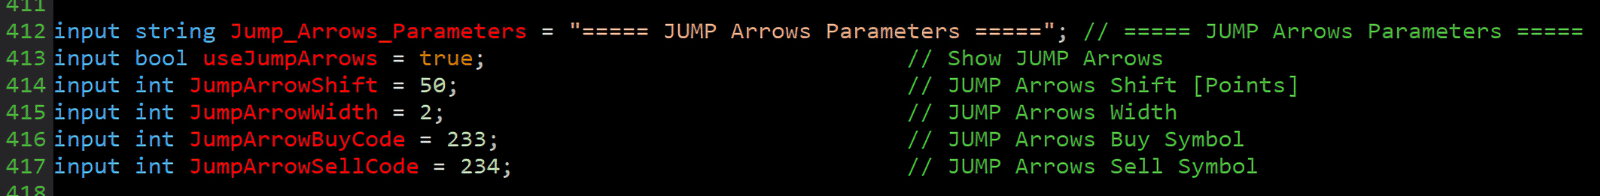
In the EA's settings panel, we've added a new section, ===== JUMP Arrows Parameters =====, which gives you full control over the markers' appearance:
- Show JUMP Arrows: The main switch for the feature – you can enable or disable it with a single click.
- UMP Arrows Shift [Points]: Defines the arrow's distance from the signal candle (in points), helping to avoid obscuring the price and maintaining chart clarity.
- JUMP Arrows Width: Allows you to change the thickness of the drawn arrow.
- JUMP Arrows Buy/Sell Symbol: For advanced users – the ability to change the arrow's symbol code (e.g., from default arrows to dots, diamonds, or other characters from the Wingdings font).
Key Benefits for Your Trading
- Precise Analysis: See the exact moment and candle that triggered the strategy's logic. No more guessing why the EA decided to open a setup.
- Effective Verification in the Tester: Signal visualization is invaluable during backtesting. It allows you to quickly verify if the EA is responding to setups as you expect.
- Operational Transparency: Observe the robot's "thinking" in real-time, which builds confidence in the strategy and makes optimization easier.
- Better Strategy Understanding: By analyzing historical visual signals, you can better understand the market conditions in which the JUMP & FLIP strategy performs best.
The update is available now and, as always, is completely free for all our clients. Log in to your client panel to download the latest version.