
Products
Daily Support and Resistance
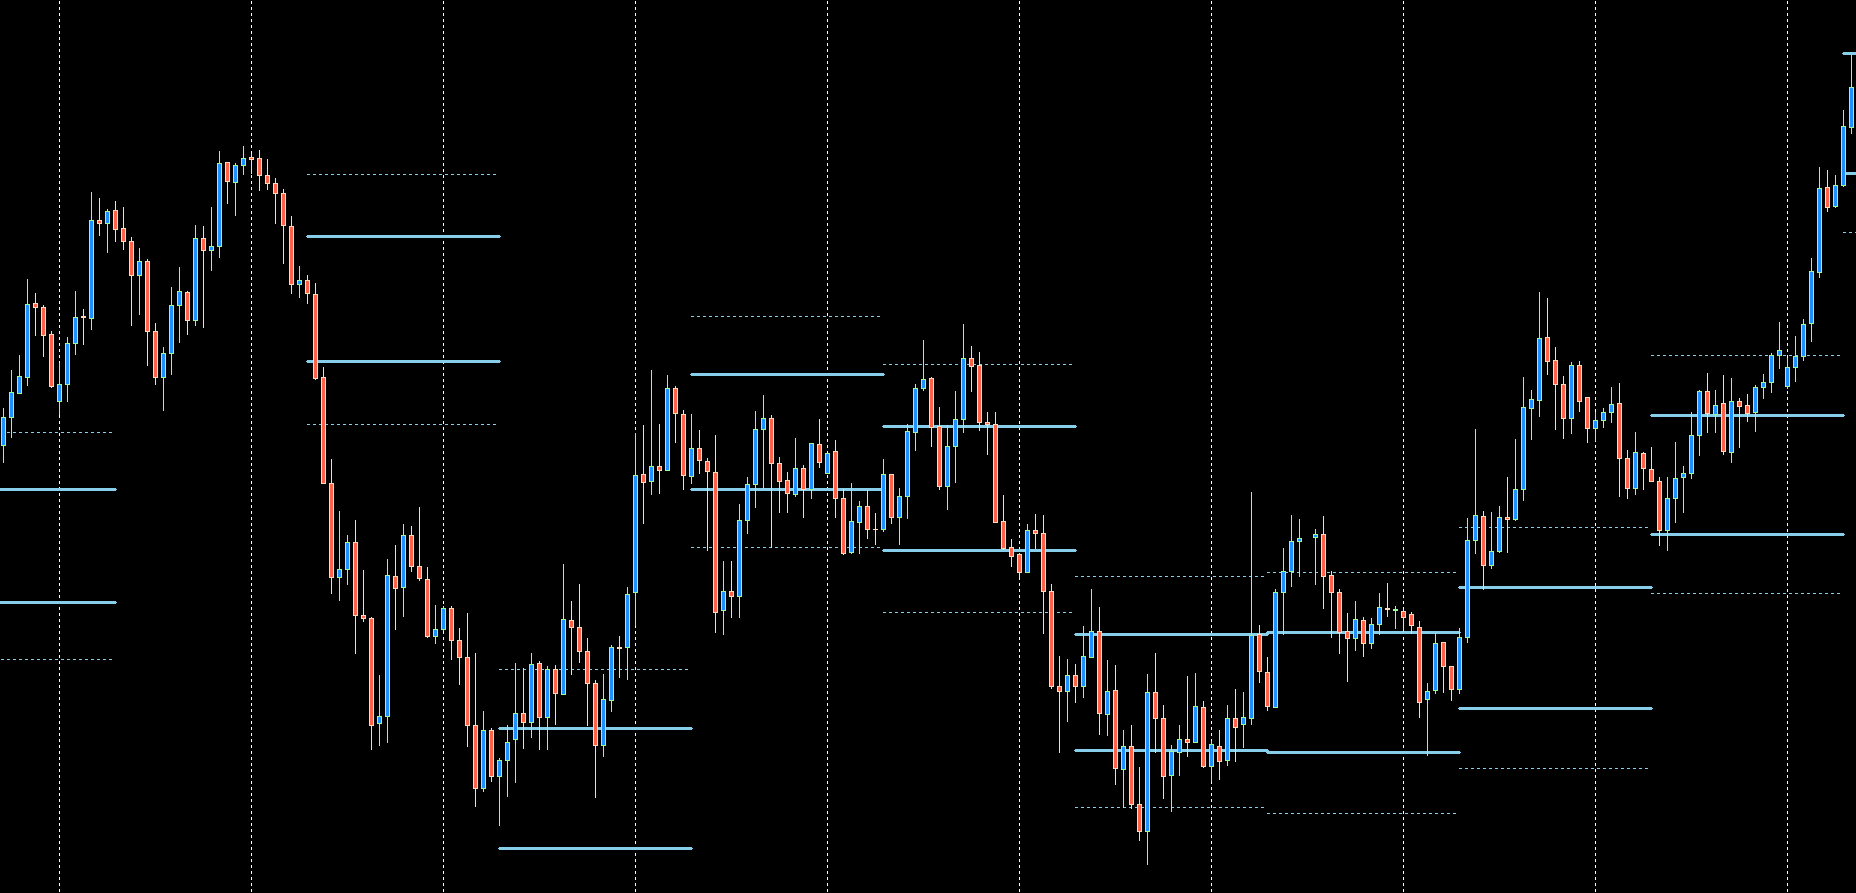
SkyBlue Levels – Daily Supports and Resistances – indicate the range in which the price is moving on a given day. SkyBlue levels are published daily from 6:00 a.m. to 8:00 a.m. (GMT).
By using artificial intelligence to study repetitive price behavior, we found that it can be used as daily support and resistance.
The maximum movements for a given day are the SkyBLueExtension levels - extreme, dashed lines - but statistically the price moves between SkyBlue levels - thicker, internal lines.
If the price at 22:00 (GMT) is outside the SkyBlueExt level range, it should return to this range during the Asian session.
Statistics say that if the price at 22:00 (GMT) is outside the SkyBlue level range, it should also return to this range within 2-3 days - although it usually returns much earlier.
Returns to the SkyBlue and SkyBlueEx level range are well over 90% effective.

SB 20
-
History
AUDUSD - SkyBlue 21 days -
History
EURUSD - SkyBlue 21 days -
History
GBPUSD - SkyBlue 21 days -
History
USDCAD - SkyBlue 21 days -
History
USDCHF - SkyBlue 21 days -
History
USDJPY - SkyBlue 21 days -
Renewal period
-
Price 40 £
- 20 trading days history for SkyBlue levels - Daily S/R. The package contains data for currency pairs: AUDUSD, EURUSD, GBPUSD, USDCAD, USDCHF, USDJPY.

SB 40
-
History
AUDUSD - SkyBlue 41 days -
History
EURUSD - SkyBlue 41 days -
History
GBPUSD - SkyBlue 41 days -
History
USDCAD - SkyBlue 41 days -
History
USDCHF - SkyBlue 41 days -
History
USDJPY - SkyBlue 41 days -
Renewal period
-
Price 70 £
- 40 trading days history for SkyBlue levels - Daily S/R. The package contains data for currency pairs: AUDUSD, EURUSD, GBPUSD, USDCAD, USDCHF, USDJPY.

SB 60
-
History
AUDUSD - SkyBlue 61 days -
History
EURUSD - SkyBlue 61 days -
History
GBPUSD - SkyBlue 61 days -
History
USDCAD - SkyBlue 61 days -
History
USDCHF - SkyBlue 61 days -
History
USDJPY - SkyBlue 61 days -
Renewal period
-
Price 90 £
- 60 trading days history for SkyBlue levels - Daily S/R. The package contains data for currency pairs: AUDUSD, EURUSD, GBPUSD, USDCAD, USDCHF, USDJPY.

SB AUDUSD 20
-
History
AUDUSD - SkyBlue 21 days -
Renewal period
-
Price 10 £
- 20 trading days history for SkyBlue levels - Daily S/R. Data for currency pairs AUDUSD.

SB EURUSD 20
-
History
EURUSD - SkyBlue 21 days -
Renewal period
-
Price 10 £
- 20 trading days history for SkyBlue levels - Daily S/R. Data for currency pair EURUSD.

SB GBPUSD 20
-
History
GBPUSD - SkyBlue 21 days -
Renewal period
-
Price 10 £
- 20 trading days history for SkyBlue levels - Daily S/R. Data for currency pair GBPUSD.

SB USDCAD 20
-
History
USDCAD - SkyBlue 21 days -
Renewal period
-
Price 10 £
- 20 trading days history for SkyBlue levels - Daily S/R. Data for currency pair USDCAD.
SB USDCHF 20
-
History
USDCHF - SkyBlue 21 days -
Renewal period
-
Price 10 £
- 20 trading days history for SkyBlue levels - Daily S/R. Data for currency pair USDCHF.

SB USDJPY 20
-
History
USDJPY - SkyBlue 21 days -
Renewal period
-
Price 10 £
- 20 trading days history for SkyBlue levels - Daily S/R. Data for currency pair USDJPY.