
Products
Weekly Support and Resistance
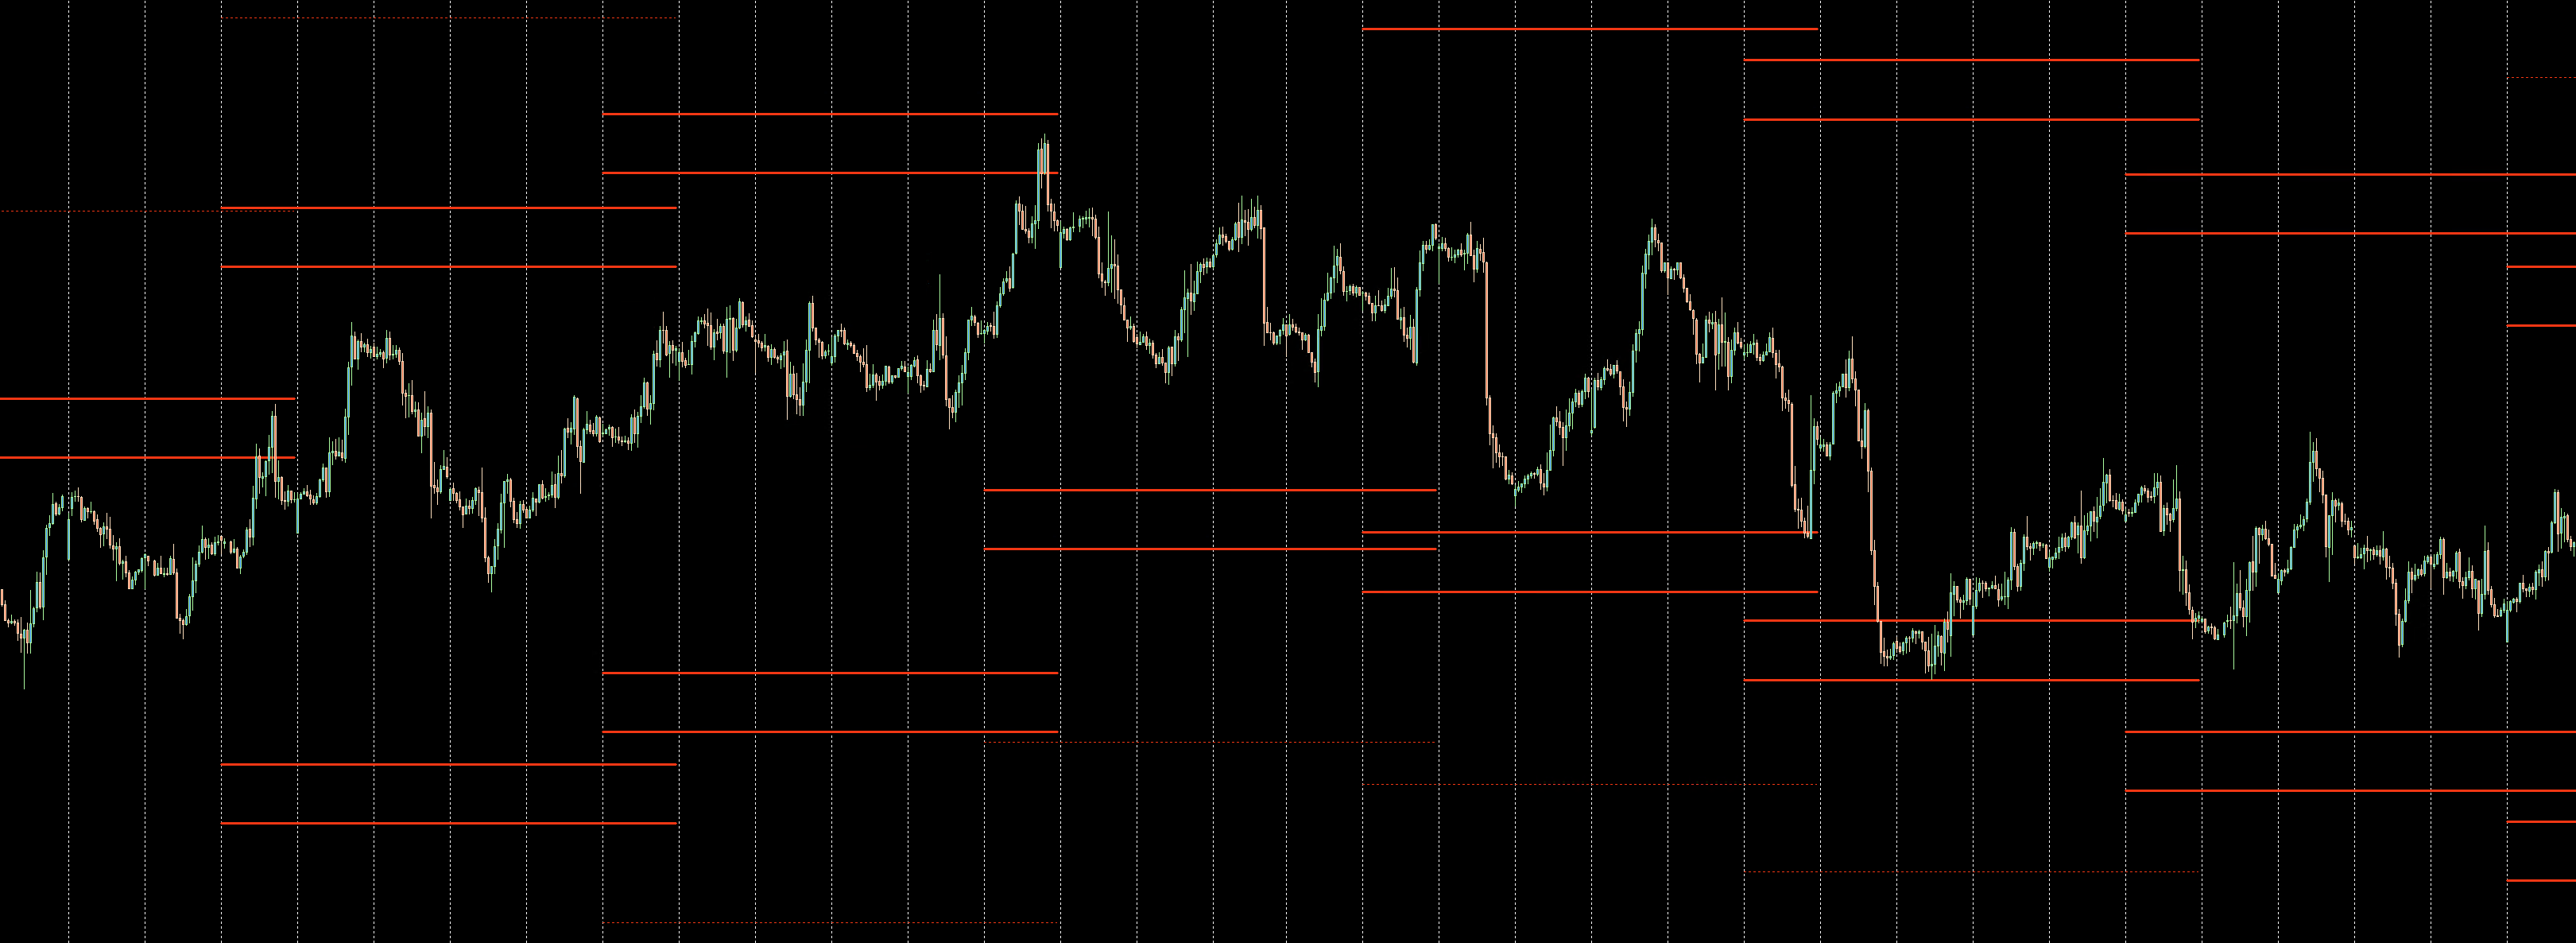
RED levels - weekly support and resistance - indicate the range in which price is moving in a given week.
ATTENTION!!! A week in the DML model lasts from Wednesday to Wednesday of the following week. This may be confusing for beginners, but this model best matches the repeating price behavior of currency pairs.
Red levels are usually published on Wednesdays between 1:00 p.m. and 5:00 p.m. (GMT).
By using artificial intelligence to study repetitive price behavior, we discovered that RED levels could be used as weekly Support and Resistance.
The maximum movements for a given week are determined by the REDex levels - extreme, dashed lines - but statistically the price moves between RED levels - a zone marked by two, thicker, internal lines.
If the price is outside the RED range before 1:00 p.m. (GMT) on Tuesday, it should return to the RED range over the next few sessions.
The effectiveness of keeping the price within the RED range is well over 93%. Price maintenance within the REDe levels range is well over 97%.

RED 20
-
History
AUDUSD - Red 24 days -
History
EURUSD - Red 24 days -
History
GBPUSD - Red 24 days -
History
USDCAD - Red 24 days -
History
USDCHF - Red 24 days -
History
USDJPY - Red 24 days -
Renewal period
-
Price 40 £
- 20 trading days history for Red levels - Weekly S/R. The package contains data for currency pairs: AUDUSD, EURUSD, GBPUSD, USDCAD, USDCHF, USDJPY.

RED 40
-
History
AUDUSD - Red 44 days -
History
EURUSD - Red 44 days -
History
GBPUSD - Red 44 days -
History
USDCAD - Red 44 days -
History
USDCHF - Red 44 days -
History
USDJPY - Red 44 days -
Renewal period
-
Price 70 £
- 40 trading days history for Red levels - Weekly S/R. The package contains data for currency pairs: AUDUSD, EURUSD, GBPUSD, USDCAD, USDCHF, USDJPY.

RED 60
-
History
AUDUSD - Red 64 days -
History
EURUSD - Red 64 days -
History
GBPUSD - Red 64 days -
History
USDCAD - Red 64 days -
History
USDCHF - Red 64 days -
History
USDJPY - Red 64 days -
History
USDPLN - Red 64 days -
Renewal period
-
Price 90 £
- 60 trading days history for Red levels - Weekly S/R. The package contains data for currency pairs: AUDUSD, EURUSD, GBPUSD, USDCAD, USDCHF, USDJPY.

RED AUDUSD 20
-
History
AUDUSD - Red 24 days -
Renewal period
-
Price 10 £
- 20 trading days history for Red levels - Weekly S/R. Data for currency pair AUDUSD.
RED EURUSD 20
-
History
EURUSD - Red 24 days -
Renewal period
-
Price 10 £
- 20 trading days history for Red levels - Weekly S/R. Data for currency pair EURUSD.

RED GBPUSD 20
-
History
GBPUSD - Red 24 days -
Renewal period
-
Price 10 £
- 20 trading days history for Red levels - Weekly S/R. Data for currency pair GBPUSD.

RED USDCAD 20
-
History
USDCAD - Red 24 days -
Renewal period
-
Price 10 £
- 20 trading days history for Red levels - Weekly S/R. Data for currency pair USDCAD.

RED USDCHF 20
-
History
USDCHF - Red 24 days -
Renewal period
-
Price 10 £
- 20 trading days history for Red levels - Weekly S/R. Data for currency pair USDCHF.

RED USDJPY 20
-
History
USDJPY - Red 24 days -
Renewal period
-
Price 10 £
- 20 trading days history for Red levels - Weekly S/R. Data for currency pair USDJPY.